
How to Validate Stent Designs Using Advanced CFD Blood Flow Analysis
In the high-stakes world of medical device engineering, the margin for error is effectively zero. When designing coronary stents, you aren’t just managing structural integrity; you are managing the delicate, chaotic interaction between a foreign metal scaffold and human biology.
As a simulation engineer who has spent the last 15 years modeling complex flows, I have witnessed a paradigm shift. Computational Fluid Dynamics (CFD) has evolved from a “nice-to-have” visualization tool into a critical pillar of the FDA regulatory submission process. It allows us to peer inside the artery with a level of resolution that no physical camera can match, quantifying forces like Wall Shear Stress (WSS) and Oscillatory Shear Index (OSI) that are invisible to the naked eye but deadly to the patient.
In this guide, we will move beyond the basics. We will explore how to rigorously validate stent designs, navigating the complexities of non-Newtonian blood rheology, pulsatile flow, and ASME V&V 40 standards. Whether you are an R&D manager looking to reduce recall risk or an engineer aiming to master hemodynamic simulation, this is your blueprint for success.
Why is CFD Critical for Modern Stent Development?
The traditional iterative cycle of “design, prototype, test in animals, fail, redesign” is becoming financially unsustainable. A single animal study can cost upwards of $100,000 and take months to execute, only to yield data that is subject to significant biological variability. Furthermore, relying solely on in vivo data creates a “black box” problem: you know that a stent failed, but you often don’t know why.
CFD blood flow analysis breaks open that black box.
By implementing high-fidelity simulations, engineers can screen hundreds of geometric variations virtually—altering strut thickness, connector shapes, and crown angles—before cutting a single piece of metal. This isn’t just about saving money; it’s about robust design verification.
Consultant’s Note: The FDA is no longer just “accepting” CFD data; they are actively encouraging in silico clinical trials. Under the ASME V&V 40 standard (Verification and Validation of Computational Modeling of Medical Devices), simulation results can now serve as valid evidence to support safety claims. This regulatory acceptance means that a well-validated CFD report can significantly shorten your timeline to 510(k) clearance or PMA approval.
The business case is clear: CFD reduces prototyping cycles by 30-50%. It allows you to fail fast and cheap in the digital world so you can succeed in the real one.
How Does Stent Geometry Impact Hemodynamics?

Designing a stent is an exercise in managing conflict. Mechanically, you need thick, robust struts to maintain radial strength and prevent vessel recoil. Hemodynamically, however, every micron of strut thickness acts as an obstacle to flow.
Think of a stent strut like a bridge piling in a fast-moving river.
- Upstream: The flow impacts the face of the strut (stagnation point).
- Downstream: The flow separates, creating a wake of low-velocity, recirculating fluid behind the strut.
In a river, this wake collects debris. In an artery, these recirculation zones are where blood residence time increases, promoting the accumulation of fibrin and platelets. This is the precursor to thrombosis.
The Geometrical Trade-off
Through countless coronary stent design optimization projects, we have observed that “streamlining” strut cross-sections (e.g., using tear-drop shapes vs. rectangular profiles) can drastically reduce flow separation. However, manufacturing constraints often limit us to laser-cut tubes with rectangular profiles.
Therefore, the engineer’s task is to optimize the macro-geometry:
- Strut Connectivity: Open-cell designs generally disrupt flow less than closed-cell designs but offer less plaque coverage.
- Strut Thickness: Reducing thickness from 100 µm to 60 µm has been shown in benchmarking results to significantly lower the volume of recirculation zones.
- Crown Angle: Sharp angles can create localized turbulence, necessitating smooth transitions.
By using cfd blood flow analysis, we can visualize these wake structures and quantitatively compare the “hemodynamic footprint” of Design A versus Design B.
What Are the Key Metrics for Predicting Thrombosis?

To translate colorful CFD contours into actionable engineering decisions, we need rigorous metrics. You cannot simply look at a velocity plot and say, “That looks bad.” You must quantify the risk. The two most critical indicators we track are Wall Shear Stress (WSS) and Oscillatory Shear Index (OSI).
1. Wall Shear Stress (WSS)
WSS is the frictional force exerted by blood flow tangentially on the vessel wall. It is the “Goldilocks” metric of hemodynamics:
- Too Low (< 0.5 Pa): Low shear promotes endothelial dysfunction. It signals flow stagnation, allowing atherogenic particles to infiltrate the vessel wall. This is the primary driver of restenosis and neointimal hyperplasia.
- Too High (> 70 Pa): Extremely high shear, often found at the leading edge of struts, can physically damage blood components (hemolysis) or activate platelets, triggering the clotting cascade.
- Just Right (1 Pa – 7 Pa): The physiological range where endothelial cells remain healthy and aligned with the flow.
2. Oscillatory Shear Index (OSI)
While WSS measures magnitude, OSI measures directionality. Blood flow in coronary arteries is pulsatile; it reverses and accelerates with every heartbeat.
- OSI ranges from 0 to 0.5. * A value of 0 means flow is always in one direction (healthy).
- A value of 0.5 means the flow direction is oscillating completely (highly disturbed).
Pro-Tip: High OSI regions usually correlate with low average WSS. When evaluating a new stent design, I advise my clients to calculate the “Area at Risk”—the total surface area of the vessel wall where WSS < 0.5 Pa and OSI > 0.2. Minimizing this surface area is a direct proxy for reducing thrombosis risk prediction.
How Do You Set Up an Accurate Blood Flow Simulation?
Setting up a bio-CFD simulation is not like simulating air over a wing. The physics are messier, the geometry is organic, and the margin for error is slimmer. A “garbage in, garbage out” approach here can lead to misleading safety conclusions.
Here is a technical walkthrough of the pre-processing phase required for high-fidelity Ansys Fluent biomedical applications.
1. Geometry Acquisition
It starts with patient-specific data. We typically import geometries from DICOM data (CT or MRI scans). However, raw medical scans are noisy. You must clean the surface mesh, removing artifacts while preserving the physiological curvature of the vessel. The stent geometry is then “deployed” virtually into this vessel using structural FEA (Finite Element Analysis) before the fluid domain is extracted.
2. Boundary Conditions: Steady-State vs. Pulsatile
For a quick screening, a steady-state simulation using average velocity is acceptable. But for FDA-grade validation, pulsatile flow CFD simulation is mandatory. You must apply a time-varying velocity profile at the inlet (based on physiological waveforms) and a time-varying pressure condition at the outlet. This captures the critical diastolic/systolic phases where flow reversal might occur.
Why Must We Model Blood as Non-Newtonian Fluid?

This is where many junior engineers make a critical mistake. They assume blood behaves like water (Newtonian fluid), meaning its viscosity is constant regardless of how fast it flows.
Blood is not water. It is a suspension of red blood cells, white blood cells, and platelets in plasma.
- At high shear rates (in the center of the artery), the red blood cells align with the flow, and blood behaves almost like a Newtonian fluid.
- At low shear rates (recirculation zones behind stent struts), the red blood cells tumble and aggregate, causing the effective viscosity to skyrocket.
If you use a Newtonian model, you will underestimate viscosity in the very regions you care about most—the stagnation zones behind the struts. This leads to an underestimation of the recirculation zone size and an inaccurate WSS calculation.
To capture this accurately, we use Non-Newtonian blood viscosity models such as the Carreau-Yasuda or Power Law models. These models dynamically adjust viscosity based on the local strain rate in every cell of the mesh.
How Critical is Mesh Strategy for Accurate Results?
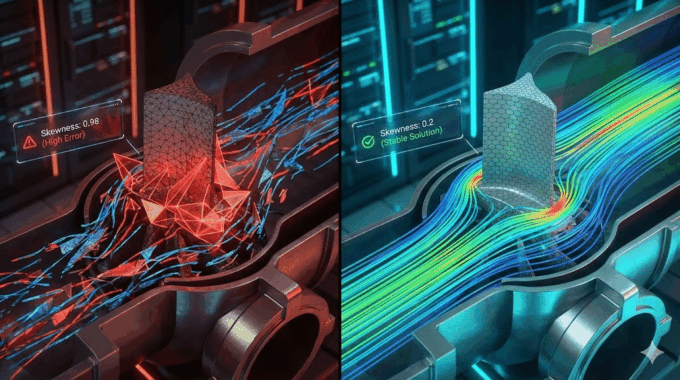
In cfd blood flow analysis, your mesh is your microscope. If the mesh is too coarse, you will blur out the details that matter.
The gradients of velocity and shear stress near the stent struts are extremely steep. To capture them, you need a highly refined mesh in the boundary layer.
- Inflation Layers: We typically generate 10-15 prismatic inflation layers growing off the stent surface and vessel wall. The first layer height must be small enough to keep the non-dimensional wall distance (y+) close to 1, ensuring accurate shear stress calculation.
- Mesh Type: Modern Poly-Hexcore meshing (available in Ansys Fluent) is excellent here. It fills the bulk volume with efficient hexahedral cells while using flexible polyhedra to conform to the intricate stent geometry.
Consultant’s Note: Always perform a grid independence study. Run the simulation with 2 million, 5 million, and 10 million cells. If your WSS values change significantly between the versions, your mesh is not yet fine enough. This is a core requirement for ASME V&V 40 compliance. At MR CFD, we utilize robust HPC (High-Performance Computing) clusters to handle these massive datasets, ensuring that we never compromise on resolution for the sake of runtime.
How Can MR CFD Consulting Accelerate Your R&D?
Understanding the physics is one thing; executing it within a tight R&D deadline is another. Setting up a transient, non-Newtonian, patient-specific stent simulation requires a unique blend of biomedical knowledge and advanced Ansys Fluent capability.
If your team is struggling to correlate simulation data with experiments, or if you are preparing for a critical regulatory submission, this is where we step in.
- CFD Consulting Services: We can act as your dedicated simulation department. We handle the geometry cleaning, meshing, and solving, delivering a comprehensive report validated against peer-reviewed numerical methods and tailored for FDA submission.
- Ansys Fluent Course: If you prefer to build this capability in-house, we offer specialized training. Our courses don’t just teach you which buttons to click; we teach you the methodology—how to select the right turbulence model, how to script UDFs for custom viscosity, and how to post-process complex hemodynamics data.
Leveraging MR CFD expertise ensures that your simulation strategy is not just a scientific experiment, but a calibrated business tool that reduces risk and accelerates your time to market.
What is the Future of In Silico Trials in Medicine?
We are standing on the precipice of a new era. The concept of the “Digital Twin” is moving from aerospace into medicine. In the near future, we will not just simulate a generic artery; we will simulate your artery.
Imagine a world where a doctor can scan a patient, generate a Digital Twin, and virtually deploy ten different stent sizes and designs to see which one yields the best hemodynamic outcome for that specific anatomy. This is the promise of personalized medicine.
Furthermore, virtual clinical trials are gaining traction. Instead of recruiting 2,000 diverse patients for a trial, we can generate 2,000 anatomical variations virtually and run cfd blood flow analysis on all of them. This allows us to identify edge cases—anatomies where a specific stent design might fail—that would be statistically impossible to catch in a traditional human trial.
By mastering these tools today, you are future-proofing your engineering career and your company’s product pipeline.
Frequently Asked Questions
What software is best for cfd blood flow analysis?
While open-source codes like OpenFOAM are capable and cost-effective options for academic research, Ansys Fluent remains the industry standard for commercial medical device development. Its dominance is due to its robust, validated solvers, comprehensive support for multiphase and non-Newtonian flows, and widespread acceptance by regulatory bodies like the FDA. At MR CFD, we specialize in Ansys workflows specifically because they offer the reliability and traceability required to ensure regulatory compliance and data integrity.
Can CFD replace animal testing for stents?
Not entirely, but it drastically changes the ratio of testing. Simulation cannot yet fully replicate the complex biological healing response or long-term tissue remodeling. However, cfd blood flow analysis significantly reduces the volume of animal testing required. By using simulation to filter out poor designs early, you only take the most promising candidates to animal trials. The FDA’s push for in silico trials (supported by ASME V&V 40) confirms that rigorous simulation data allows engineers to screen thousands of designs virtually, saving millions in testing costs.
How does Non-Newtonian modeling affect simulation time?
Modeling blood as a Non-Newtonian fluid increases computational cost, typically by 20-30% per iteration compared to a Newtonian model. This is because the solver must calculate the viscosity at every cell based on the local shear rate, rather than treating it as a constant. However, for stent design, this cost is unavoidable. In low-shear regions behind struts, Newtonian models fail to predict viscosity accurately, leading to significant errors in Wall Shear Stress (WSS) prediction. For medical safety, this accuracy is non-negotiable.
What is the ideal Wall Shear Stress (WSS) range?
From a hemodynamic perspective, the “healthy” physiological range for arterial WSS is generally considered to be between 1 Pa and 7 Pa.
- < 0.5 Pa: Suggests flow stagnation and recirculation. This low shear environment allows for prolonged particle residence time, significantly increasing the risk of thrombosis and intimal hyperplasia.
- > 10-70 Pa: extremely high shear (often found at the leading edges of malapposed struts) can cause high shear platelet activation or hemolysis (damage to red blood cells). Designers aim to keep the majority of the vessel surface within that 1-7 Pa window.
Does MR CFD offer training for biomedical engineers?
Yes. We offer specialized Ansys Fluent Courses tailored specifically for the biomedical sector. Unlike generic CFD training, our biomedical modules focus on the unique challenges of the field: handling complex anatomical geometries (STL/DICOM imports), setting up pulsatile velocity waveforms using User Defined Functions (UDFs), and implementing Non-Newtonian blood viscosity models. We teach you to build a simulation workflow that stands up to scrutiny from senior engineers and regulators alike.
Related Posts
Errors Occurring in Simulations with ANSYS Fluent: A Technical Guide to Convergence & Stability
ANSYS Fluent simulates engineering problems based on the Finite Volume Method (FVM). Consequently, the errors…

How Ansys HPC Servers Accelerate Your Fluent Dynamic Simulations
We have all been there. You hit “Calculate” on a transient simulation, and the estimated…

Ansys HPC Case Study: Accelerating a 120-Million Cell Simulation Using MR CFD’s Ansys HPC Service
In the high-stakes world of aerodynamics, fidelity is everything. But as engineers, we often hit…

Comments (0)