Project Outsourcing
Outsource your project to the MR CFD simulation engineering team. Our experts are ready to carry out every CFD project in all related engineering fields. Our services include industrial and academic purposes, considering the ANSYS Fluent software's wide range of CFD simulations. By outsourcing your project, you can benefit from MR CFD's primary services, including Consultation, Training, and CFD Simulation. The project freelancing procedure is as follows:
An official contract will be set based on your project description and details.
As we start your project, you will have access to our Portal to track its progress.
You will receive the project's resource files after you confirm the final report.
Finally, you will receive a comprehensive training video and technical support.
What is Porous Media?
A porous medium is a substance that contains pores or spaces between solid materials through which liquid or gas can pass. Examples of naturally occurring porous media include sand, soil, and some types of stone, such as pumice and sandstone. Sponges, ceramics, and reticulated foam are also manufactured as porous media. The possible applications of these materials in science, industry, and everyday life are vast, although they are perhaps most commonly used as filters. Physically, a porous medium can be distinguished from other materials — including other porous media — by its porosity or the size of its pores. Materials with low porosity are less permeable and typically have smaller pores, making it more difficult for gas or liquid to pass through them.
In contrast, materials with high porosity have large pores and are easily permeated. Porosity is essential in filtering since a porous medium must remove particles. The pores must be small enough to trap them effectively. When observing oil and natural gas reservoirs, geologists consider the surrounding stone and soil’s porosity. Natural gas trapped in low-porosity stone is known as “tight gas” and is more difficult to access than other reserves.
Porosity ranges from a low percentage in dense shale and sandstone to about 50% in the sand and up to 70% in clay. Artificial materials can be even more porous. For example, reticulated foam, a porous medium used in air conditioner filters and cosmetic applicators, has a porosity of up to 98%.
A group of materials known as porous media is defined by the presence of pores, channels, or interstices within its overall structure. These pores can accommodate a fluid, whether a liquid or a gas, which then can move across the interconnected network of pores.
The following are examples of porous media:
– Components derived from the earth, such as wood, soil, and rock
– Tissues found in living organisms
– Materials used in engineering, including things like ceramics and concrete
– Membranes and filters, respectively
Porosity, permeability, and pore size distribution are some of the features that define porous media. These characteristics distinguish porous media.
- The ratio of the volume of voids (or pores) to the overall volume of the material is referred to as the substance’s porosity. It indicates how much liquid the material is capable of storing.
- Permeability measures a material’s ability to enable fluids to move through without being stopped or restricted. It depends on the pore’s size, shape, and how well they are connected.
- The range of distinct pore sizes within the material can be described using the term “pore size distribution,” as can the frequency with which those hole sizes occur.
In many branches of science and engineering, such as geology (for example, oil and gas extraction), environmental science (for example, groundwater flow and contamination), civil engineering (for example, soil mechanics and groundwater flow), and chemical engineering (for example, catalysis and filtration), porous media play an essential part.
How can Porous Media CFD simulation be applied in Engineering and Industries?
The simulation of porous media using computational fluid dynamics (CFD) has a wide range of potential applications in the engineering and industrial sectors. The following are some possible applications:
- In the oil and gas industry, computational fluid dynamics (CFD) simulations can be used to understand better the flow of oil, gas, and Water through reservoir rocks. This knowledge can help maximize the amount of oil and gas extracted.
- In environmental engineering, computational fluid dynamics (CFD) simulations may be utilized to model the movement of pollutants in groundwater via porous media such as soil and rock.
- In civil engineering, computational fluid dynamics (CFD) simulations can help design foundations and earth structures by predicting how water will move through the soil.
– Chemical Engineering, Computational Fluid Dynamics (CFD) simulations of porous media can be utilized to design and optimize chemical reactors. This is especially useful in heterogeneous catalysis, in which the catalyst is frequently a porous medium.
– In the automotive industry, CFD simulations can simulate and enhance the performance of porous materials, such as oil and air filters. These filters can be oil filters and air filters.
– The Porous Media of the Energy Sector Simulations created using CFD are used to develop fuel cells and batteries, two technologies that frequently use porous materials.
– Biomedical Engineering, CFD simulations can be used in tissue engineering to help understand the flow of nutrients and waste in the created tissue, which frequently acts like a porous medium. This is one application of biomedical engineering.
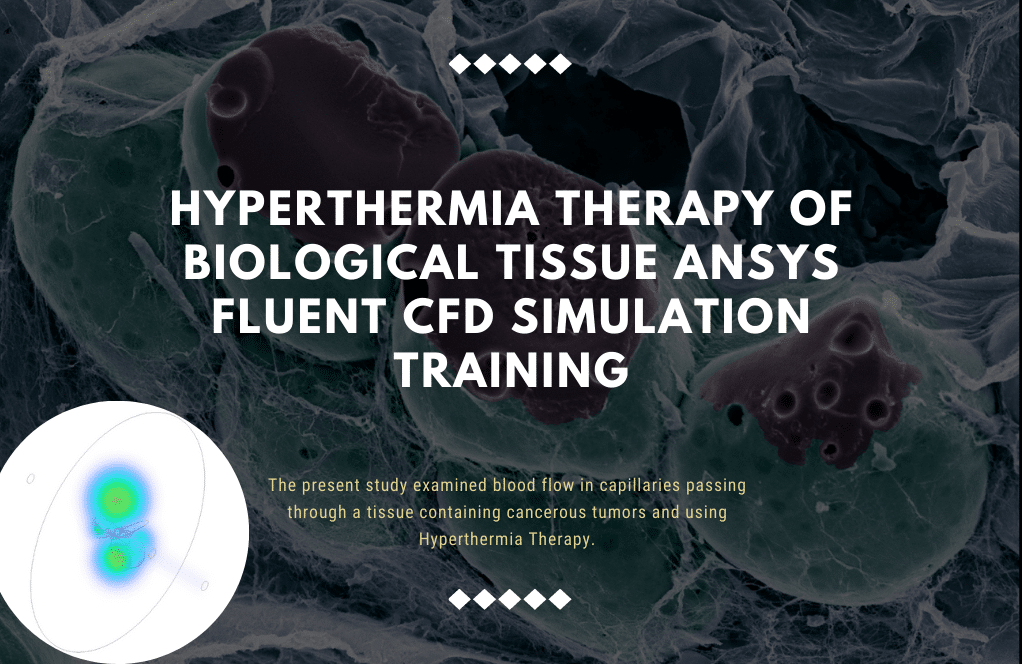
Hyperthermia Therapy of a Cancer Tissue
Surgery, radiation therapy, and chemotherapy are common approaches to cancer treatment. Aggressiveness, irreversibility, and adverse effects are all problems associated with these techniques. In Hyperthermia Therapy, the warming process blocks the delivery of oxygen and nutrients to the diseased tissue. So altered, tissue proteins can form a protective barrier around cancer cells. Because of this, the immune system can now recognize cancer cells.

Four spherical malignant tumors of varying dimensions may be seen at the tissue’s core and along its veins’ outer surface. Healthy tissue and cancer cells have different thermophysical characteristics. To keep things straightforward, however, we will assume that healthy tissue has thermophysical parameters equivalent to those of diseased cells. Heat energy per unit of volume is produced by all malignant tissues, causing heat transfer and a dramatic rise in blood flow. This research examines how the body’s blood vessels and other tissues react to hyperthermia therapy.
We show volume rendering (3D Contour) and contours of the velocity, pressure, and temperature in the domain, together with each component, to shed light on the situation in the current simulation. The outlines in the Figures show the temperature distribution around the blood tumors, representing this simulation’s most significant difficulty.
– Agriculture, CFD simulations can be helpful in understanding and optimizing irrigation and drainage systems by modeling how Water flows through porous soil. This can be accomplished by knowing how water moves through the mud.
To summarize, computational fluid dynamics (CFD) simulations of porous media provide valuable insights into the complicated flow phenomena in porous structures. These simulations allow engineers and scientists to improve designs and processes, anticipate performance, and find solutions to issues connected to the flow of fluids in porous media.
MR CFD services in the Porous Media Simulation for Engineering and Industries
With several years of experience simulating various problems in various CFD fields using ANSYS Fluent software, the MR CFD team is ready to offer extensive modeling, meshing, and simulation services. Simulation Services for Porous Media simulations are categorized as follows:
- Premixed Combustion in Porous Zone
- Capillary Action (wicking), Water flows in porous media
- Multiphase Flow in Porous Medium, Filter Cake Formation
- Water infiltration into a porous concrete block
- Porous Mixer for Increasing the Heat Transfer of Nanofluid
- Non-Equilibrium Heat Transfer in Porous Aluminum Foam Heat Sink
- …
MR CFD is a professional engineering service provider that delivers a comprehensive range of computational fluid dynamics (CFD) services, including porous media simulations, for various engineering applications and industries.
The following is a list of some of the services that they provide:
– CFD Consulting: MR CFD has a team of experienced engineers and researchers on staff that can provide expert advice and solutions for complex fluid dynamics issues involving porous media. MR CFD’s services may be found here.
– Computational Fluid Dynamics (CFD) Simulation: They provide high-quality CFD simulations using cutting-edge software tools. These simulations can help gain knowledge of fluid flow behavior in porous media and optimize engineering systems’ design and overall performance.
– Modeling of Porous Media: MR CFD is an expert in several porous media models, such as Darcy’s law, the Brinkman equation, and the Forchheimer equation, among others. They can pick and use the model that is the best fit for the project depending on the particular specifications that are needed.
– Postprocessing and Analysis: MR CFD will comprehend the results’ postprocessing and analysis once the simulations have been completed. This comprises the flow field’s display, the performance characteristics’ computation, and the interpretation of the results in the context of the project’s objectives.
– Training and Support: MR CFD also provides training and support services in computational fluid dynamics (CFD) and porous media simulation. This covers a variety of educational opportunities, such as classes, workshops, and online help.
– Customized Solutions: MR CFD recognizes that every engineering challenge is one of a kind and offers individualized responses to these challenges. They provide individualized solutions adapted to meet the requirements and boundaries of each project.

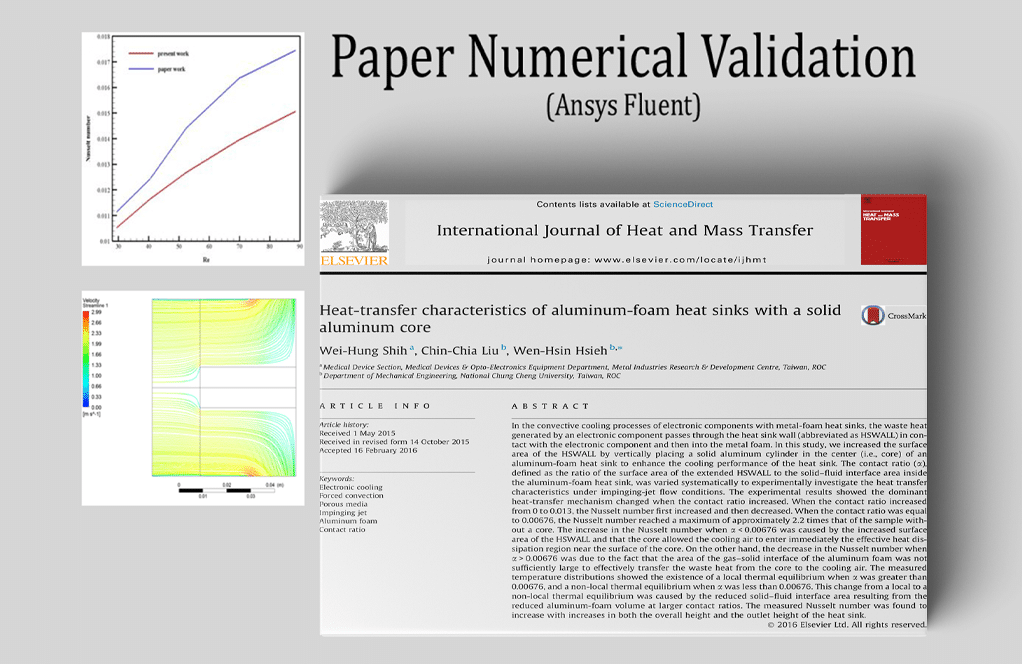
Heat transfer characteristics of aluminum-foam heat sink with a solid aluminum core.
In this experiment, we model the airflow entering a vertical cylinder housing an aluminum fin attached to a heat sink. The material that makes up the domain is permeable. ANSYS Fluent models a porous aluminum foam heat sink in a non-equilibrium state. This issue examines the effect that varying the Reynolds number has on the Nusselt number (the convection-conductivity ratio) in the porous section of the chamber.
By the end of the solution process, we know how much the Nusselt number varies depending on the Reynolds number of the air entering the chamber at the contact surface between the solid fin and the porous material at the bottom. We check our findings against Figure 3 in the article for confirmation.
Premixed Combustion in a Porous Zone
The simulation results of Premixed Combustion in a Porous Zone have been analyzed in the project using ANSYS Fluent. We conduct a CFD study and experimentation for this Project. Three-dimensional velocity, air/water volume fraction, and animation are the final results of the solution procedure. The results demonstrate that compared to a non-porous zone, the porous zone results in a lower static temperature and more consistent, uniform combustion.
In this scenario, we use ANSYS Fluent to model the burning of methane gas in a vertical lime kiln. We conduct a CFD study and experimentation for this project. Two- and three-dimensional pressure, temperature, velocity, and mass fraction O2, CH4, H2O, CO2, N2, and CaCO3 contours were acquired at the end of the solution process.
The pictures reveal that carbon dioxide and water vapor are formed during combustion between the reactants (methane fuel and airflow). Combustion reactions also produce large amounts of heat. Quicklime is made by dissolving calcium carbonate or limestone using heat from the combustion reaction.
Nanofluid Porous Mixer for Increasing Heat Transfer
In this study, researchers looked at what happens when two streams of nanofluid, one at 303k and the other at 293k, are mixed using 28 mixers and then 54 mixers modeled as a porous medium. Vectors and contours of velocity, static pressure, and temperature are calculated. The photos show that the velocity contour is smoother for the 2-row scenario. This is because there are fewer cubes for the flow to collide with, resulting in less of a change in velocity gradient. You can expect higher top and average speeds if you have four rows.
This suggests that the separations are more significant in the 2-row instance, even though the number of separation zones is more significant in the 4-row example. In addition, the pressure gauges reveal that the 2-row case experiences a more severe negative pressure. Bernoulli’s equation also explains this phenomenon. At the domain’s summit, where the temperature is lowest, the pressure is more significant than at any other location. The highest and average temperatures, as measured by thermometers, are identical for the two scenarios.
The range of temperature changes is less, and the changes are slower in the 4-row case because of the form of the geometry. We show the temperature distribution along the geometric axis of the center. Due to the increased number of separation zones in the 4-row scenario, the temperature is highest near the geometry’s center.
Capillary Action (wicking), Water flows in porous media
Capillary action and water flow through porous media have been simulated in this research using ANSYS Fluent. We conduct a CFD study and experimentation for the project. When a liquid moves via a capillary, it does so in a confined region without the help of, or even against, external forces like gravity.
Three-dimensional velocity, air/water volume fraction, and animation are the final results of the solution procedure. This demonstrates that the capillary effect causes the water in a container to begin moving upward, eventually reaching the vessel’s rim.
How to Model Porous Media inside ANSYS Fluent
The porous media model can be used for various single-phase and multiphase problems, including flow through packed beds, filter papers, perforated plates, flow distributors, and tube banks. When you use this model, you define a cell zone in which the porous media model is applied, and the pressure loss in the flow is determined. Heat transfer through the medium can also be represented, subject to the thermal equilibrium assumption between the medium and the fluid flow.
The porous media models for single-phase and multiphase flows use the Superficial Velocity Porous Formulation as the default. ANSYS Fluent calculates the superficial phase or mixture velocities based on the volumetric flow rate in a porous region. However, it is essential to note the following for multiphase flow:
- In the Eulerian multiphase model (this section in the separate Theory Guide), the general porous media modeling approach, physical laws, and equations described below are applied to the corresponding phase for mass continuity, momentum, energy, and all the other scalar equations.
- The Superficial Velocity Porous Formulation generally gives good representations of the bulk pressure loss through a porous region. However, since the superficial velocity values within a porous area remain the same as those outside it, it cannot predict the velocity increase in permeable zones, thus limiting the model’s accuracy.
Porous media are modeled using a momentum source term to the standard fluid flow equations. The source term comprises a viscous loss term (Darcy) and an inertial loss term. Where is the source term for the ith (x, y, or z) momentum equation, is the magnitude of the velocity, and D and C are prescribed matrices. This momentum sink contributes to the pressure gradient in the porous cell, creating a pressure drop proportional to the fluid velocity (or velocity squared) in the cell.
In ANSYS Fluent, modeling porous medium requires several tasks to be completed. The following is an essential instruction guide on how to carry it out:
– specify the Geometry and Mesh: The first stage is to determine your model’s geometry, which includes the porous media region. The next step is to define the mesh that will be used to represent the geometry. After that, a mesh should be generated for the geometry.
– Set Up the Model: After importing the mesh into Fluent, you must configure the model by selecting the proper solver settings, material properties, and boundary conditions.
– Define the Porous Zone: Select the cell zone corresponding to the porous media within the’ Cell Zone Conditions’ option. Use the zone’s context menu to select “Type,” then change it to “Porous.” After that, you will need to provide the properties of the porous media, which are as follows:
– Porous Zone Type: The type of porous zone might be either “Inertial Resistance,” “Viscous Resistance,” or “Permeability.” The option is determined by the properties of the porous medium you are working with.
– Direction Vector specifies the fluid’s path through the porous medium. Flow in the x-direction is typically set to [1, 0, 0]. Flow in the y-direction generally is set to [0, 1, 0]. And for flow in the z-direction, it is typically set to [0, 1].
– Resistance Coefficients: These are the viscous and inertial resistance coefficients, respectively. They can be determined by considering the porosity and permeability of the porous medium.
– Permeability: You must provide the permeability of the porous media if you choose “Permeability” as the porous zone type.
– Set Up the Solution: Specify the Methods, Controls, and Initialization of the Solution.
– Run the Simulation: Carry Out the Simulation Carry out the simulation while keeping an eye on the residuals to make sure that it converges.
– Postprocessing: Postprocessingze the data when the simulation is finished when the simulation is finished.
Keep in mind that this is just an essential guide. Depending on the particulars of your issue, the stages and settings may need to be adjusted differently. In addition, it is essential to validate your model by contrasting the simulation outcomes with experimental data or analytical answers. Because of this, the accuracy and dependability of your model will be improved.
Porous Media MR CFD Projects
MR CFD has successfully finished a diverse assortment of projects that involved porous medium. The following are some examples:
Heat Exchanger Design

Nano Fluid Heat Transfer in a Porous Heat Exchanger
This study uses ANSYS Fluent to simulate and analyze heat transfer during a nanofluid flow over a porous media heat exchanger. Many academics have studied fluid flow and heat transmission in porous media over the last few decades. When pores and apertures are included in the volume of a material, we get a porous medium.
Industrial uses for porous media are numerous and varied, including but not limited to heat exchangers with recovery, efficient building insulation, and crude oil extraction. (Nanofluid) The velocity of the incoming flow is 1.63 m/s. Tube has a temperature of 293 k, while porous has a temperature of 343 k. The energy simulation has begun.
Pressure, speed, temperature, streamlines, and velocities are all extracted as boundary conditions by the solution’s finish. The outlines depict temperature gradients, particularly in the prosthetic region, where velocity vectors are aligned with the cavities.
Groundwater Flow Simulation: MR CFD has simulated groundwater flow through a porous material called the “Groundwater Flow Simulation.” The simulation helped us understand the behavior of the groundwater system and develop methods for efficiently managing groundwater.
Fuel Cell Modeling
MR CFD has modeled the flow of gases in a fuel cell, which involves flow through porous electrodes. This was accomplished as part of the fuel cell modeling. The performance of the fuel cell was evaluated with the help of the model, which was then used to locate areas in which improvements could be made.
A solid oxide fuel cell (SOFC) is simulated numerically in this research using ANSYS Fluent. The chemical energy stored in fuel can be transformed into usable electricity using a fuel cell. Fuel cells come in various forms, with SOFC, PEMFC, etc., just a few examples. The solid oxide fuel cell is simulated here. This fuel cell can function in extremely hot conditions. The cathode and anode are the two main components of a solid oxide fuel cell. The electrolyte layer in the fuel cell’s core connects these sub-parts. In both the anode and cathode, there are two layers of electrode and collector.
The electricity is collected using collectors composed of solid material. There is a gas tube inside these current collectors. Both air and hydrogen fuel enter the fuel cell via gas channels, the former from the cathode collector and the latter from the anode collector. To conduct ions, electrode layers must be porous. In the cathode electrode, oxygen combines with free electrons to form positive ions. On the other hand, the anode electrode forms water when hydrogen mixes with oxygen ions and free electrons.
The positive oxygen ion conductor is a ceramic, electrolytic layer in the middle of the device. These electrons produce electricity when they enter the collectors and the rest of the cell’s circuit. Two-dimensional contours of oxygen, hydrogen, and water mass fractions are obtained from the computations. These outlines prove without a doubt that electrochemical reactions are taking place in the fuel cell.
The experiments proved that oxygen enters the cathode and hydrogen at the anode. The results reveal that water has formed on the anode side of the fuel cell, even though there was initially no water inside the fuel cell. The fuel cell has completed the electrochemical reaction involving oxygen, hydrogen, and electrons.
We also map out the electric potential and current distributions inside the fuel cell. The creation of an electric current is depicted accurately by these outlines. In a fuel cell, electricity is produced when a potential difference develops between the cathode and anode sides. Thus, we can conclude that the solid oxide fuel cell device functions as intended.
Proton Exchange Membrane Fuel Cell (PEMFC)
This study simulates a proton exchange membrane fuel cell using the computational fluid dynamics (CFD) numerical simulation approach and the ANSYS Fluent software. Fuel cells are cleaner than other power generation systems since they produce energy through a chemical reaction. The PEMFC model is used to simulate a fuel cell in this investigation.
This research seeks to understand better how the mass fraction of gaseous species and the amount of electricity produced in a polymer fuel cell are affected by the cell’s fluid behavior and thermal conductivity. Once the simulation is complete, the results are displayed as contours. An electric current is produced when hydrogen and oxygen react. The catalytic layer enhances transmission across the electrolyte membrane that connects the cathode and anode.
Polymer Electrolyte Membrane Fuel Cell (PEMFC)
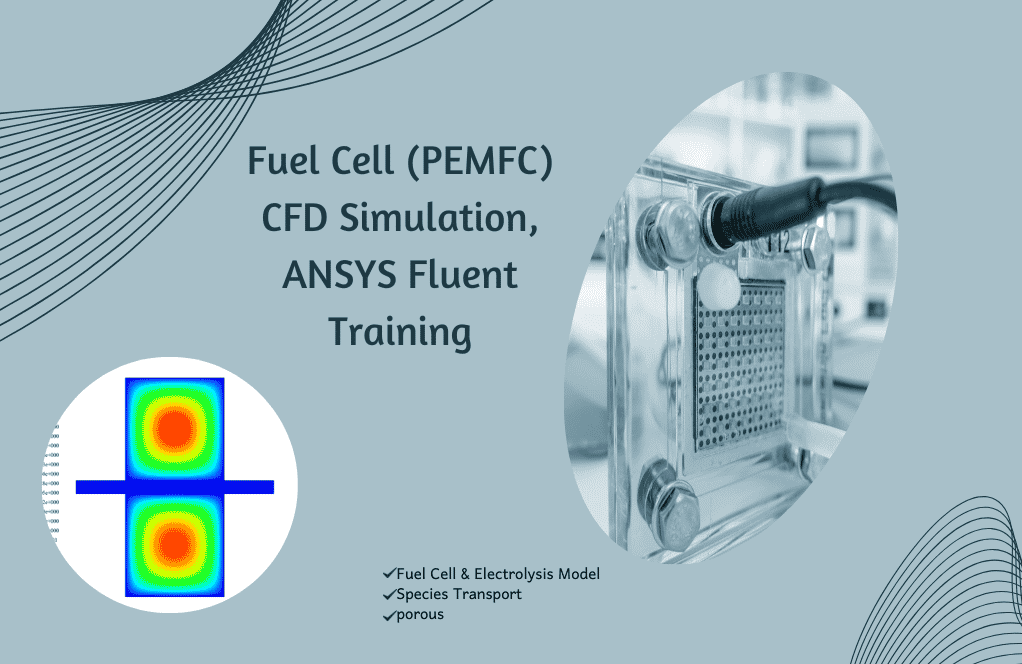
ANSYS Fluent’s PEMFC (polymer electrolyte membrane fuel cell) model in the porous medium simulates a fuel cell. The model has two primary parts, the cathode, and the anode. These devices have four layers, with the polymer membrane occupying the gap between the anode and cathode. These layers include the flow collector, the flow channel, the gas distribution area, and the catalytic section.
Since it is assumed that the anode potential is zero, just half a potential, or 0.5, is defined for the cathode. Additionally, the mass fractions of hydrogen, Water, oxygen, and nitrogen at the anode inlet are 0.7, 0.3, 0, and 0, respectively. They are 0.0, 0.14, 0.66, and 0.2 at the cathode inlet.
This research aims to learn how the mass fraction of gaseous species and the amount of electricity produced in a polymer fuel cell are affected by the cell’s fluid behavior and thermal conductivity. Once the simulation is complete, the results are displayed as contours. Hydrogen and oxygen ions go across the electrolyte membrane as predicted. In addition, the catalyst could speed up the process, resulting in an increased electric current.
Filter Design
The engineers at MR CFD have developed a filter that uses a porous media. The design of the filter was improved with the help of the CFD model so that it could provide more effective filtration.
Multiphase Flow in Porous Medium, Filter Cake Formation
This issue requires using ANSYS Fluent to model multiphase flow through a porous media. Water-soluble particles are found in the model’s upper portion, and the porous medium is situated in the model’s lower part. At first, the particles in the water make up only 0.185 percent of the volume of the solution. The soluble particles are separated from the water flow by entering the water flow from the top of the column, providing pressure to the mixture inside the column, and passing through the pores of the porous media.
Mixture pressure, primary phase velocity, preliminary phase temperature, primary phase volume fraction, secondary phase velocity, secondary phase temperature, and secondary phase volume fraction are all represented as two-dimensional contours after the solution procedure.
The results reveal that the mixed flow is directed towards the porous media when the water flow inside the column is downwards. The mixture’s behavior suggests that only the water flow, and not the water-soluble particles, makes it through the porous media—cake filtering results from separating the soluble particles from the water flow.
Water infiltration into a porous concrete block
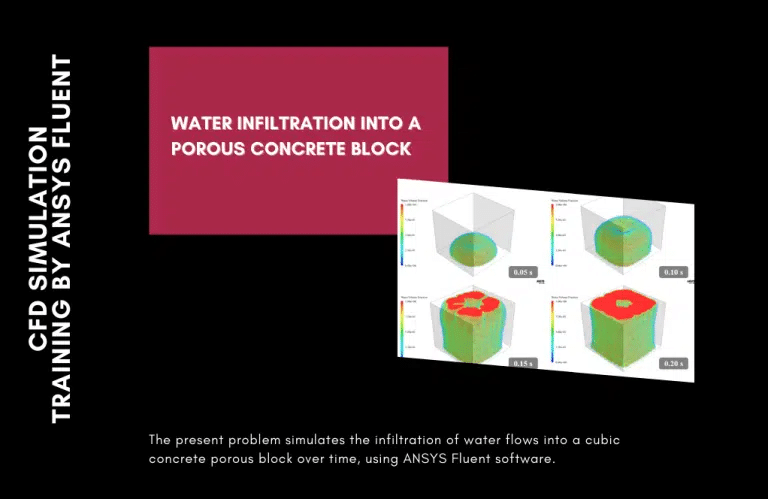
A pressure inlet boundary condition is implemented at the block input because the relative pressure of the incoming water flow is 5 bar (or 500,000 pascals). The initial state also assumes that the block is filled with air and that water can flow through it. The current study examines the rate of water infiltration into the porous block. The current issue is therefore resolved as a non-stationary and time-dependent phenomenon.
The simulation derives two- and three-dimensional pressure and water/air volume fraction contours. These profiles were captured at discrete intervals across a time window of 0.2 s. The numbers show that the rate at which water flows within the block via infiltration rises with time. It is also seen that the water flow slows down when pressure increases by passing through the interior of the porous block.
Reactor Modeling: MR CFD has modeled a chemical reactor that uses a porous catalyst through their work in reactor modeling. The kinetics of the reaction were analyzed with the help of the model, and the reactor’s design was improved as a result.
Soil Erosion Study: MR CFD Carried Out an Investigation Into Soil Erosion The investigation into soil erosion, which involved flow through a porous media, was carried out by MR CFD. The study contributed to a better knowledge of the processes that cause soil erosion and the development of efficient techniques to control erosion.
These examples illustrate MR CFD’s experience in porous media modeling and the company’s capacity to apply this expertise to resolve real-world engineering challenges. Their team utilizes cutting-edge CFD tools and techniques to provide high-quality, cost-effective solutions.
Humidification Dehumidification (HDH)
This ANSYS Fluent computational fluid dynamics (CFD) project focuses on a humidification dehumidification (HDH) system. The HDH system is a prototypical approach to desalinizing water. Humidification and dehumidification processes form the basis of this technique’s mechanism. The evaporator, or humidifier, is on one side of the system, while the condenser, or dehumidifier, is on the other.
The dehumidifier (a condenser) receives the cold water through spiral tubes. The steam inside the shell is then used to warm the interior. The water in the tube is heated because the heat transfer continues until the steam condenses. This hot water is then blasted onto the evaporator’s filter plates as it enters the humidifier.
Humidified air or wet steam is created when these droplets combine with the dry air from the condenser. The resulting steam is clean, as any contaminants are left behind in the evaporator. This clean steam is warmed in a heater before flowing into the condenser.
The previously described cold feed water lines are now in direct contact with the interior of the condenser shell. Humidification or distillation of clean water from steam is performed on it. There are two stages to this system’s mechanism: humidification and dehumidification. Therefore, this issue has been simulated twice. Humidity was the subject of the initial simulation.
Moving upwards from the chamber’s base is a stream of dry air. At the same time, heated salt water is blasted through several holes in the chamber in the form of droplets. Humid air is created when droplets in the membrane region of the chamber clash with the airflow and evaporate.
The steam here is completely desalinized. Dehumidification was the subject of the second simulation. In this process, humid airflow is generated and introduced into the chamber. The water circulation for cooling the chamber is assumed to be carried inside spiral tubes. Condensation and the creation of pure water are the results of hot steam coming into touch with the spiral tube’s cold surface.
After the first simulation, we have the resulting contours for the air mass fraction, water vapor mass fraction, and discrete particle concentration. Due to the instability of this simulation, any conclusions drawn can only be applied to the last fraction of a second.
Additionally, two animations have been created to aid in comprehending the outcomes of this topic. On a two-dimensional plane, one can examine the shape of variations in the mass fraction of produced h2O. The room is being flown through by an airplane. The other uses Particle Tracking to learn how water droplets spray over time.
Over time, the data reveal that the droplets are consistently sprayed downward from the higher apertures of the chamber to reach the dry air. Furthermore, the data show that H2O is created and diffuses upwards toward the chamber’s upper exit as time passes.

Once the second simulation is complete, we can see the velocity, temperature, mass transfer rate (from steam to water), and water/steam volume percentage in two dimensions. This simulation has been running continuously and without regard to the passage of time.
Phase transitions are revealed in the regions surrounding the cold spiral tube. According to the temperature profile, the vapor temperature has dropped below the saturation point around the cold pipe. In this case, the vapor must condense into liquid water.
The phase transition occurs below the saturation temperature, as the mass transfer demonstrates rate. When water changes from a liquid to a gas, the sign is positive but harmful when it changes the other way. Condensation can be confirmed by looking at the shape of the variations in the volume percentage of water and vapor. According to the findings, the area around the cold water pipes yields the most water.
Numerical investigation of air gap membrane distillation (AGMD): Seeking optimal performance
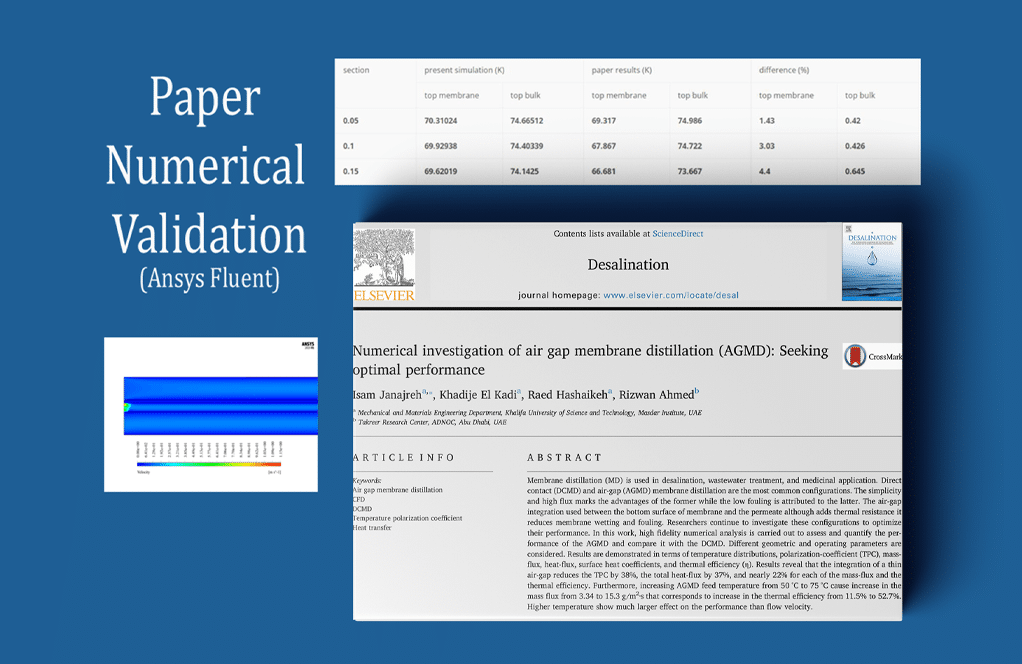
ANSYS Fluent is used to model the air gap membrane distillation (AGMD) in this scenario. This model was developed with information from the article “Numerical investigation of air gap membrane distillation (AGMD): Seeking optimal performance.” The results are compared to those in the article for verification. There are four distinct sections within the chamber of these membrane distillation systems: one for the passage of salty water (the system’s feed water), one for the transit of freshWater (the distillate), one for an air gap, and one for the membranes or filters themselves.
It is placed in a conduit that carries hot water and air. These membrane distillation systems are designed so that hot salt water flows into the chamber from one side and cold water flows in from the other. When these vapors come into contact with the space’s cold surface, they lose heat and condense into distilled, fresh water.
The inlet velocities of the hot salt water flow, the airflow, and the cold water flow are all assumed to be 0.1 m/s; the direction of salt water flow is from left to right, and the direction of air and cold water flow is from right to left because it is assumed that the water flow inside the model has a Reynolds equal to 100.
This system’s functioning mechanism involves the transfer of heat from a space associated with the flow of hot salt water to the membrane portion of the model and then from the membrane portion to the airflow portion. The current work’s findings were ultimately compared and validated against those in the cited paper. Figure 12-c of the publication (with a Reynolds number of 100 and a surface water temperature of 75 degrees Celsius) verifies this.
This is accomplished by measuring the temperatures of the fluid bulk in the passage of salt water flow space and the upper wall of the membrane space at depths of 0.05 m, 0.10 m, and 0.15 m. The REPORT command gathers the temperature data, and lines and points are drawn in the three regions.
Effects of a diffuser orifice plate on the performance of the air-cooled steam condenser
ThProject models a 600 MW power plant’s ACSC on the findings of the article “Effects of a diffuser orifice plate on the performance of air-cooled steam condenser.” The current work in numerical CFD simulation is validated by comparing the results to those found in the reference paper using ANSYS Fluent.
Power plants incorporate these systems because they are essential for preventing energy loss by condensing the hot steam from the turbine and channeling it into the pump portion of the steam turbine. Seven parallel ACSC systems make up the power plant investigated here. This CFD analysis focuses on the fourth column. There are eight fans in each row of ACSC systems, and each fan is sandwiched between two perforated plates in a diagonal pattern.
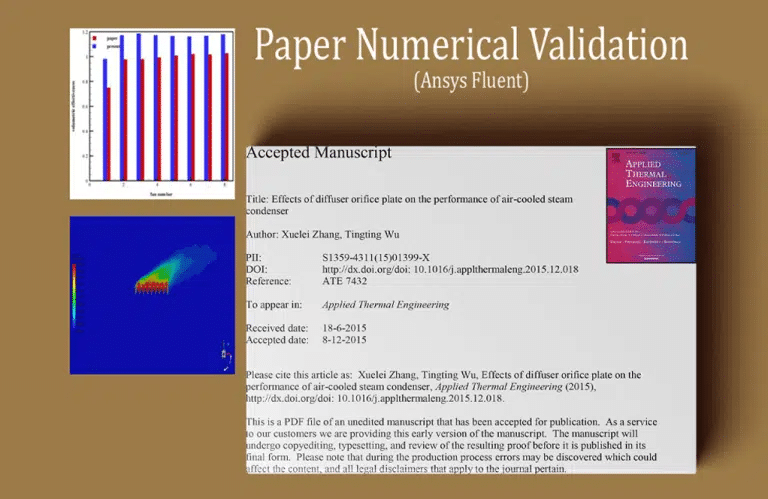
In addition, a graph showing how the volumetric efficiency of the system varies as a function of the number of fans in the system is obtained and compared to the original paper’s findings. The article’s focus diagram is associated with Figure 5-c. The primary objective of this study is to examine the impact of open airflow velocity on the volume transfer performance of the system’s fans.
The volumetric flow rate of the fans is then studied by defining a parameter without units of measurement. To express this parameter numerically, divide the volumetric flow rate transferred by the fans by the volumetric flow rate flowing from the fans in the optimum condition. The volumetric efficacy is a dimensionless parameter with an optimum value of 428 m.s-1. By comparing the outcomes of the current study to those of the article, we find that the solution’s accuracy is satisfactory, and the margin of error is small.
Air Gap Membrane Distillation (AGMD)
We use ANSYS Fluent to model air gap membrane distillation (AGMD). Water desalination can be accomplished in two broad categories: thermal and membrane. The thermal approach requires heat and a phase transition to generate potable water. In the membrane process, Water is purified by passing it through specialized membranes. These two desalination processes can be combined at times. Systems that use membrane distillation (MD) to remove salt from water are included below. The thermal and membrane processes are combined in this approach. Due to the phase transition, filters are needed to remove contaminants.
There are two different ways to proceed in this setup. The cold feed water enters the system at one end and is heated by the heater as it flows through the system. Then, this heated brine water is transferred from the system’s other side. The condensation boundary lies in the region between these two extremities. A condensing plate (where the steam is converted to water) is placed between the condensing zone and the cold side of the system, and a membrane is placed between the condensing zone and the hot side.
The condensation process is crucial to this type of desalination. However, the water flow is first cleaned by the membrane. Here are the four possibilities that may arise when heated water vapor penetrates the barrier and begins to condense: It enters a chilly stream headfirst and condenses there: Membrane distillation with direct contact is known as DCMD. It is then sent to a condensation gap where a cold stream cools it: The Air Gap Membrane Distillation (AGMD) Process.
The net flow is split off and sent to a separate condenser located outside the system, where it will be cooled and condensed. Membrane distillation under vacuum (VMD) This is the section where the gas flow is swept and subsequently condensed in a separate condenser located outside of the system, therefore separating the net flow: Membrane distillation using a sweeping gas (SGMD)
The effectiveness of the AGMD desalination system has been studied in this issue. This system’s layout is straightforward, and it just has four components. The cold water flow enters the system from the right. The system’s hot feed water is introduced from the left side. The membrane is installed close to the feed water side, and an air gap is established between the cold side and the membrane.
The assumption of previous steam conversion of the hot feed water is made for clarity. Saturated steam enters the system at this point, getting ready to condense later on in the air gap. The temperature, phase change rate, and volume fraction of water and vapor contours have been acquired once the simulation solution has been completed.
According to the findings, temperatures drop on the side of the air gap closer to the outside. The temperature contours depict the thermal boundary layer. The rate of condensation or phase change is most significant in low-temperature locations. Phase change rates with a negative sign indicate a transition from the gaseous to the liquid state.
A layer of liquid develops on the air gap’s cold plate when studying the distilled water’s volume fraction contour. The air gap’s freshwater naturally drains to its base. The outcomes validate the efficacy of the existing water desalination system and the membrane distillation process.

ANSYS Fluent models this scenario’s hydraulic, mechanical process of drying seeds. To “dry” a grain means to remove all moisture from it. To prevent rapid spoilage from mold growth, heating, and increased microbial activity during storage, the seeds’ moisture content should be reduced to a safe moisture level throughout the drying process.
To dry this project, a basic semi-cylindrical chamber is constructed. A group of grains, symbolizing wet seeds, move around the chamber at a moderate velocity due to their spherical shape. Hot air, with a temperature of 303.15 K and a velocity of 0.15 m.s-1, enters the chamber from the bottom and rises to escape at the top.
This current of hot air has the potential to transport moisture deep within the seeds. Don’t worry; it’s not going away. Moisture is transferred from the area around the seeds to the outside air. So, that’s what we mean when we talk about a “hydraulic drying mechanism.” Check out the “Grain Drying Device” or “Rice Dryer” projects, where grains are modeled using the Discrete Phase Model module, and evaporation is considered if you’re interested in dying via the evaporation mechanism. Temperature, pressure, and velocity contours are computed in two and three dimensions. The rising hot air stream dries out the seeds in the chamber, as depicted by the contours.
We use ANSYS Fluent to run a computational fluid dynamics (CFD) simulation of a reverse osmosis membrane. Through a process known as osmosis, fluid is shown to migrate from a lower- to a higher-concentration solution until equilibrium is reached. Imagine separating clean and dirty water with a membrane that only lets specific molecules through.
As a result, osmosis dictates that water will flow towards the impure side of the membrane until a pressure differential develops between the pure and impure components. The term “osmotic pressure difference” is used to describe this disparity. When the non-specific section of the system is subjected to a pressure equal to the osmotic pressure, fluid flow from the pure to the impure region is halted. If this pressure is higher than the osmotic pressure, the water will flow against its natural tendency to do so.
This mechanism is at the heart of reverse osmosis water desalination technologies. In these setups, pressure is provided the opposite. The filters remove the salt and other contaminants from the source water. There are two issues, and the project has been simulated twice. The effects of osmotic pressure on fluids are the exclusive focus of the first project. The model represents a closed chamber that has been cut in half. A barrier needs to be eliminated immediately between these two sections.
On the left side of the container is a saltwater solution, and on the right is just water. The flow of fluid between regions of various concentrations is the focus of this model. Osmotic pressure and osmotic phenomena can be expressed through this movement.
If the first is successful, the project will look into the feasibility of a reverse osmosis water desalination plant. In this model, a membrane separates the system chamber in the middle. A porous material defines the membrane. From the left intake of the model, Water and salt enter the chamber and travel to the membrane. Only clean water can pass through when a salty or highly concentrated solution reaches the membrane.
The solution process is complete, and the resulting two-dimensional contours are connected to the water and salt’s pressure and volume percentage. Since the solution is not constant, the system’s behavior over time has been determined by comparing the findings at various times. Changes in the saltwater solubility volume fraction animation have also been produced. Both simulated scenarios have the same results.
In the first scenario, the system is contained within a closed environment with no boundary conditions from the outside world. At the outset, the model’s left side has water and salt, whereas the right side contains only water. As time progresses, the fluid gradually shifts from the side with a greater concentration to the side with a lower concentration.
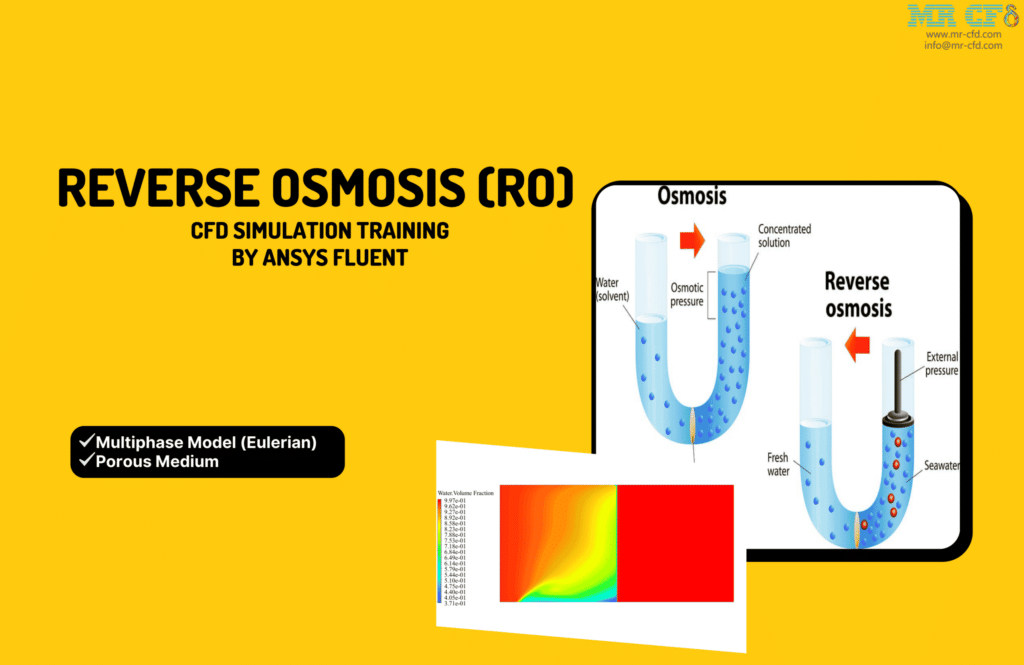
The results reveal that only clean water can travel through the membrane while the dissolved salt is left behind. This process is repeated until the solution behind the membrane is highly concentrated, and the solution after the membrane is water. These findings validate the efficacy of the reverse osmosis sweetening technology in delivering pure water. Pressure variations also demonstrate that the fluid pressure gap between the two sides of the reverse osmosis system widens as time passes.
The current work uses ANSYS Fluent to model a Transformer Room’s HVAC system. We conduct a CFD study and experimentation. Electrical induction can transfer energy between two or more windings in a transformer. For safety reasons, these transformers are kept in a room equipped with a specialized air conditioning system.
Two-dimensional pressure, temperature, and velocity contours were acquired when the solution procedure was completed. The temperature contour indicates that the forced convection and airflow velocity within the transformer room will result in general cooling.
Monte Carlo Radiation, CT scan
In this work, we employ ANSYS Fluent to perform a numerical simulation of the thermal radiation of beams during a CT scan. The current model is associated with a patient’s body resting flat under a CT scanner. The screen in the CT scanner’s upper section is a light-emitting diode (LED). Images are presented on computer screens thanks to the transmission of light radiation into the patient and its subsequent passage through the human body.
This study aims to learn more about how radiation affects people. The human body is sensitive to these light rays, which can cause serious harm if not handled carefully. Therefore, regulating radiation exposure is crucial in the healthcare sector. In the end, we got outlines for changes in the volume of radiation absorbed, the volume of radiation incident, the intensity of radiation, and the temperature.
These boundaries are shown in two different ways. To examine the course of the radiation emitted by the CT scan device, we first display the contours in the area above and below the patient’s body in the first mode. We have shown internal anatomical contours in the second mode to verify that the rays penetrate the patient’s body.
The results accurately depict how the beams from the CT scanner traveled to the patient’s body. These beams, as the diagrams illustrate, can penetrate the human body. As a result, knowing how many harmful radiations a person is exposed to can have profound medical implications. Seventh in the series of radiation model training courses.
Porous Media Industrial Companies
Numerous companies across various industries work with porous media in one way or another. Here are a few examples:
Schlumberger is one of the world’s leading oilfield services companies, which deals with porous media in the context of oil and gas reservoirs.
Pall Corporation – Pall is a global leader in filtration, separation, and purification technologies. The company designs and manufactures filters using various types of porous media.
Donaldson Company, Inc. is a leading worldwide filtration system and replacement parts provider. They deal with porous media in applications like engine and industrial air, oil, fuel, and hydraulic filters.
Freudenberg Group – Freudenberg produces a wide range of technical textiles and nonwovens, including materials that can be used as porous media for various applications.
3M – 3M is a diversified technology company with a presence in industry, worker safety, healthcare, and consumer goods. They utilize porous materials in several of their products.
Parker Hannifin – Parker Hannifin is a leading manufacturer of motion and control technologies, providing precision-engineered solutions for various mobile, industrial, and aerospace markets. They use porous media in their filtration systems.
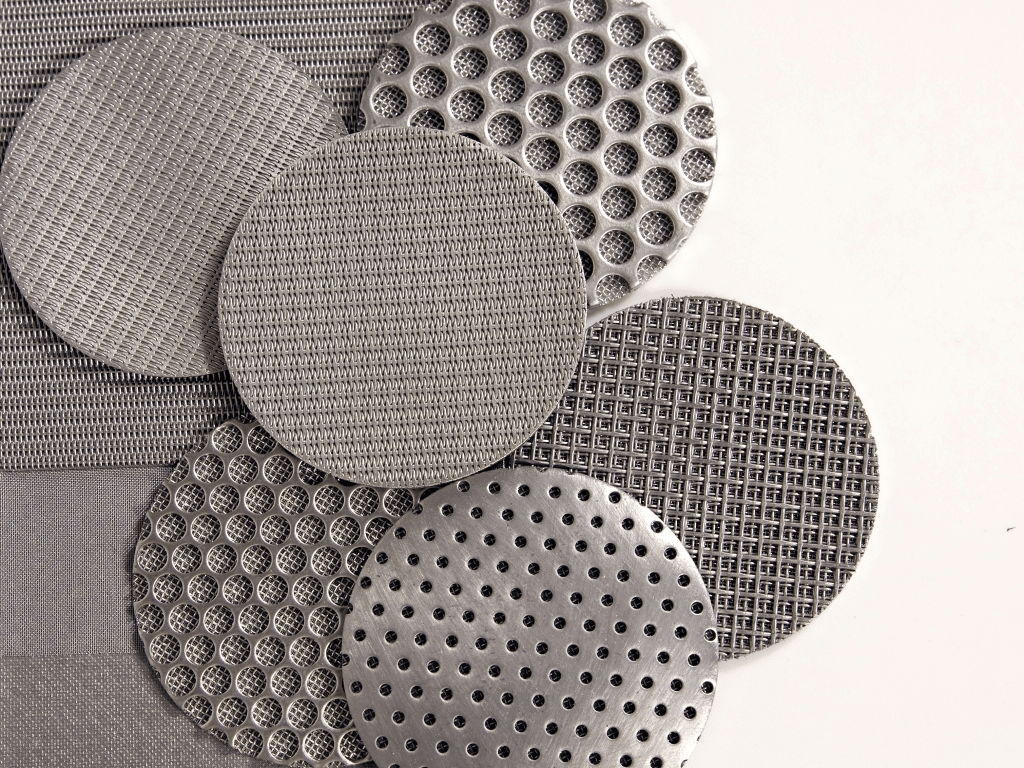
Mott Corporation specializes in high-performance, customizable sintered porous metal filters, and flow control devices. They work with various industries, including aerospace, chemical, petrochemical, and energy.
These companies represent a small fraction of the many businesses worldwide that work with porous media. The specific applications of porous media are incredibly diverse, ranging from filtration and flow control to energy production and environmental protection.
MR CFD Industrial Experience in the Porous Media Field
Some examples of Porous Medium industrial projects recently simulated and analyzed by MR CFD in cooperation with related companies are visible on MR CFD Website.
You may find the Learning Products in the Porous Media CFD simulation category in Training Shop. You can also benefit from the Porous Media Training Package, which is appropriate for Beginner and Advanced users of ANSYS Fluent. Also, MR CFD is presenting the most comprehensive Porous Media Training Course for all ANSYS Fluent users from Beginner to Experts.
Our services are not limited to the mentioned subjects. The MR CFD is ready to undertake different and challenging projects in the Porous Medium modeling field ordered by our customers. We even carry out CFD simulations for any abstract or concept Design you have to turn them into reality and even help you reach the best strategy for what you may have imagined. You can benefit from MR CFD expert Consultation for free and then Outsource your Industrial and Academic CFD project to be simulated and trained.
By outsourcing your Project to MR CFD as a CFD simulation consultant, you will not only receive the related Project’s resource files (Geometry, Mesh, Case & Data, …), but also you will be provided with an extensive tutorial video demonstrating how you can create the geometry, mesh, and define the needed settings (preprocessing, processing, and postprocessing) in the ANSYS Fluent software. Additionally, post-technical support is available to clarify issues and ambiguities.


