NACA0012 Airfoil Optimization With RBF Morph, CFD Simulation Ansys Fluent Training
$210.00 Student Discount
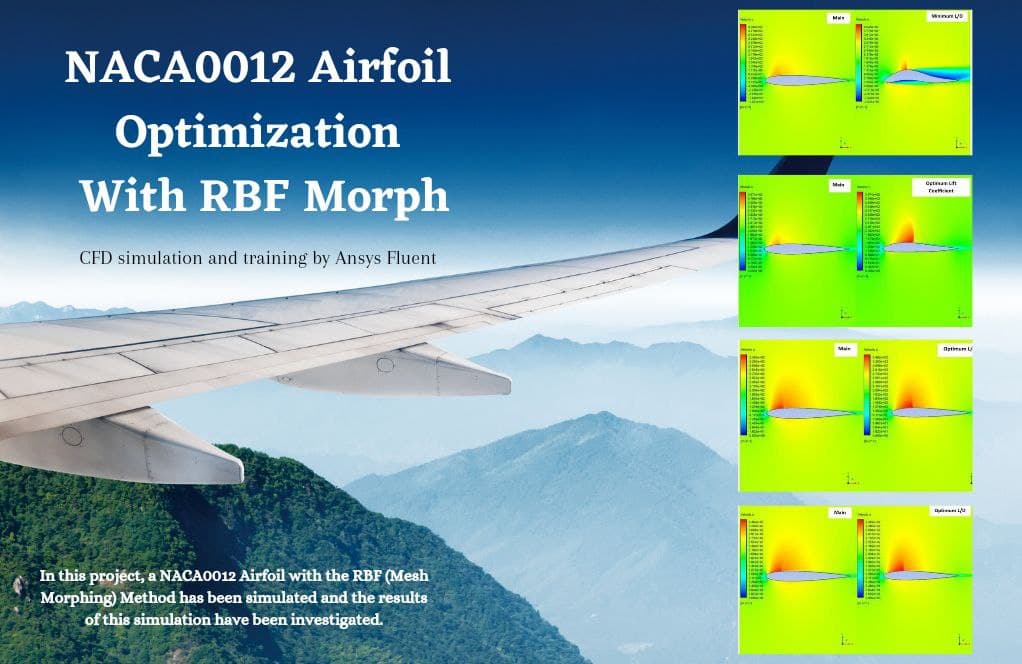
In this project, a NACA0012 Airfoil with the RBF (Mesh Morphing) Method has been simulated, and the results of this simulation have been investigated.
Click on Add To Cart and obtain the Geometry file, Mesh file, and a Comprehensive ANSYS Fluent Training Video.To Order Your Project or benefit from a CFD consultation, contact our experts via email ([email protected]), online support tab, or WhatsApp at +44 7443 197273.
There are some Free Products to check our service quality.
If you want the training video in another language instead of English, ask it via [email protected] after you buy the product.
Description
NACA0012 Airfoil Optimization Project Description
In this project, the flow inside a NACA0012 airfoil is first has been simulated by Ansys Fluent software. The angle of attack is 1.53 degrees, and the simulation has been done by the density-based solver due to the compressibility with a Mach number equal to 0.7. Then the geometry is optimized to improve lift-to-drag (L/D) as aerodynamic efficiency. All the optimization has been done by Ansys Fluent software in the Ansys Workbench environment.
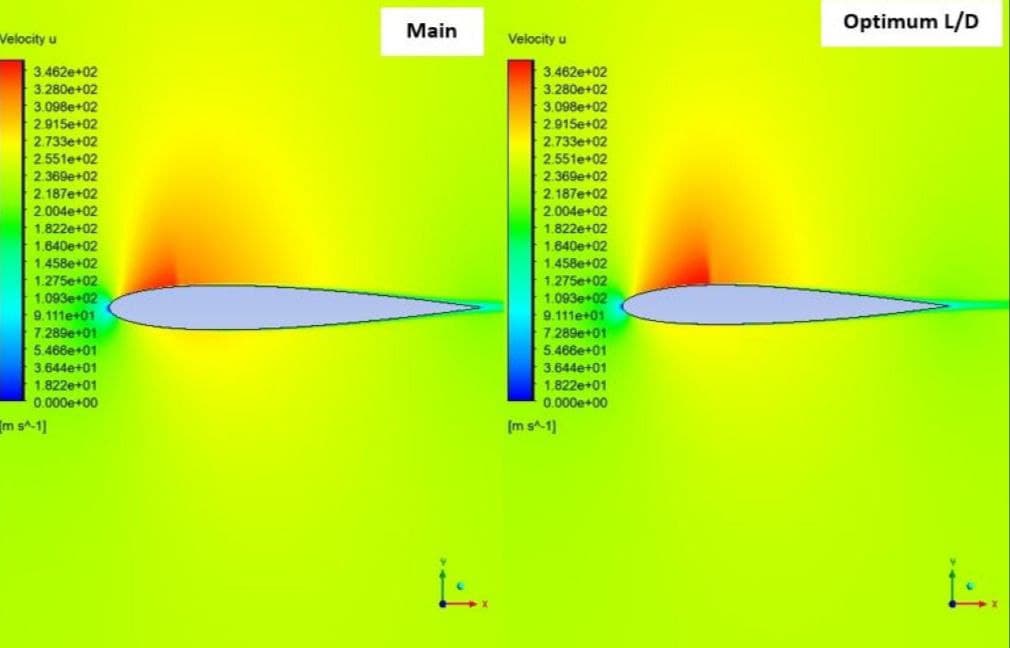
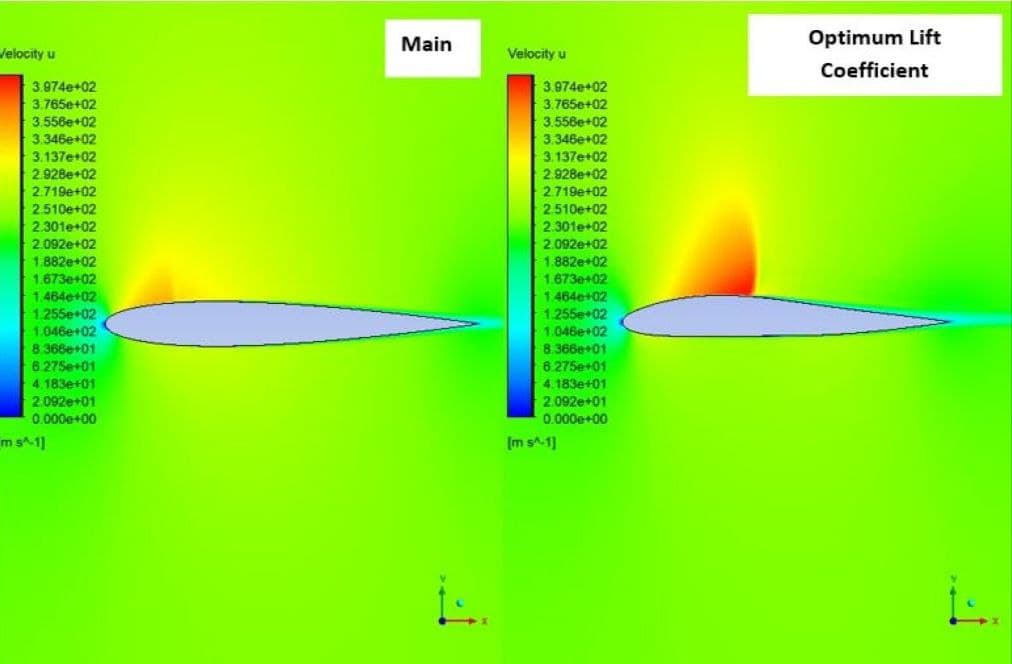
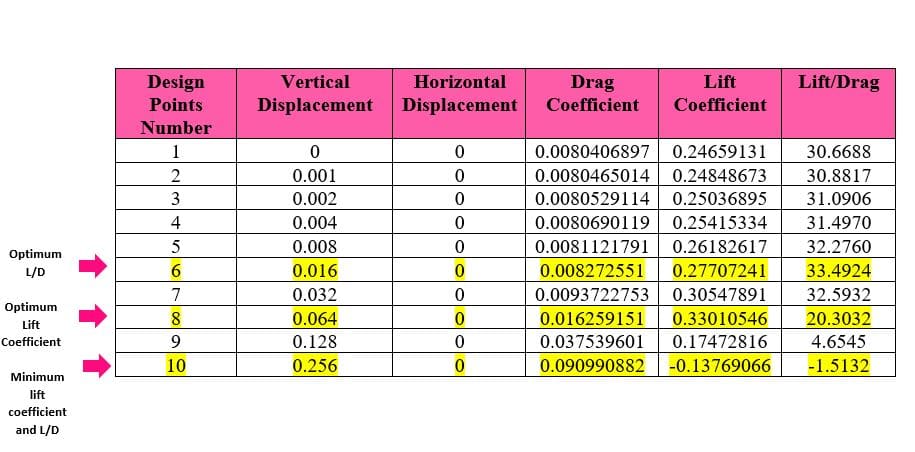
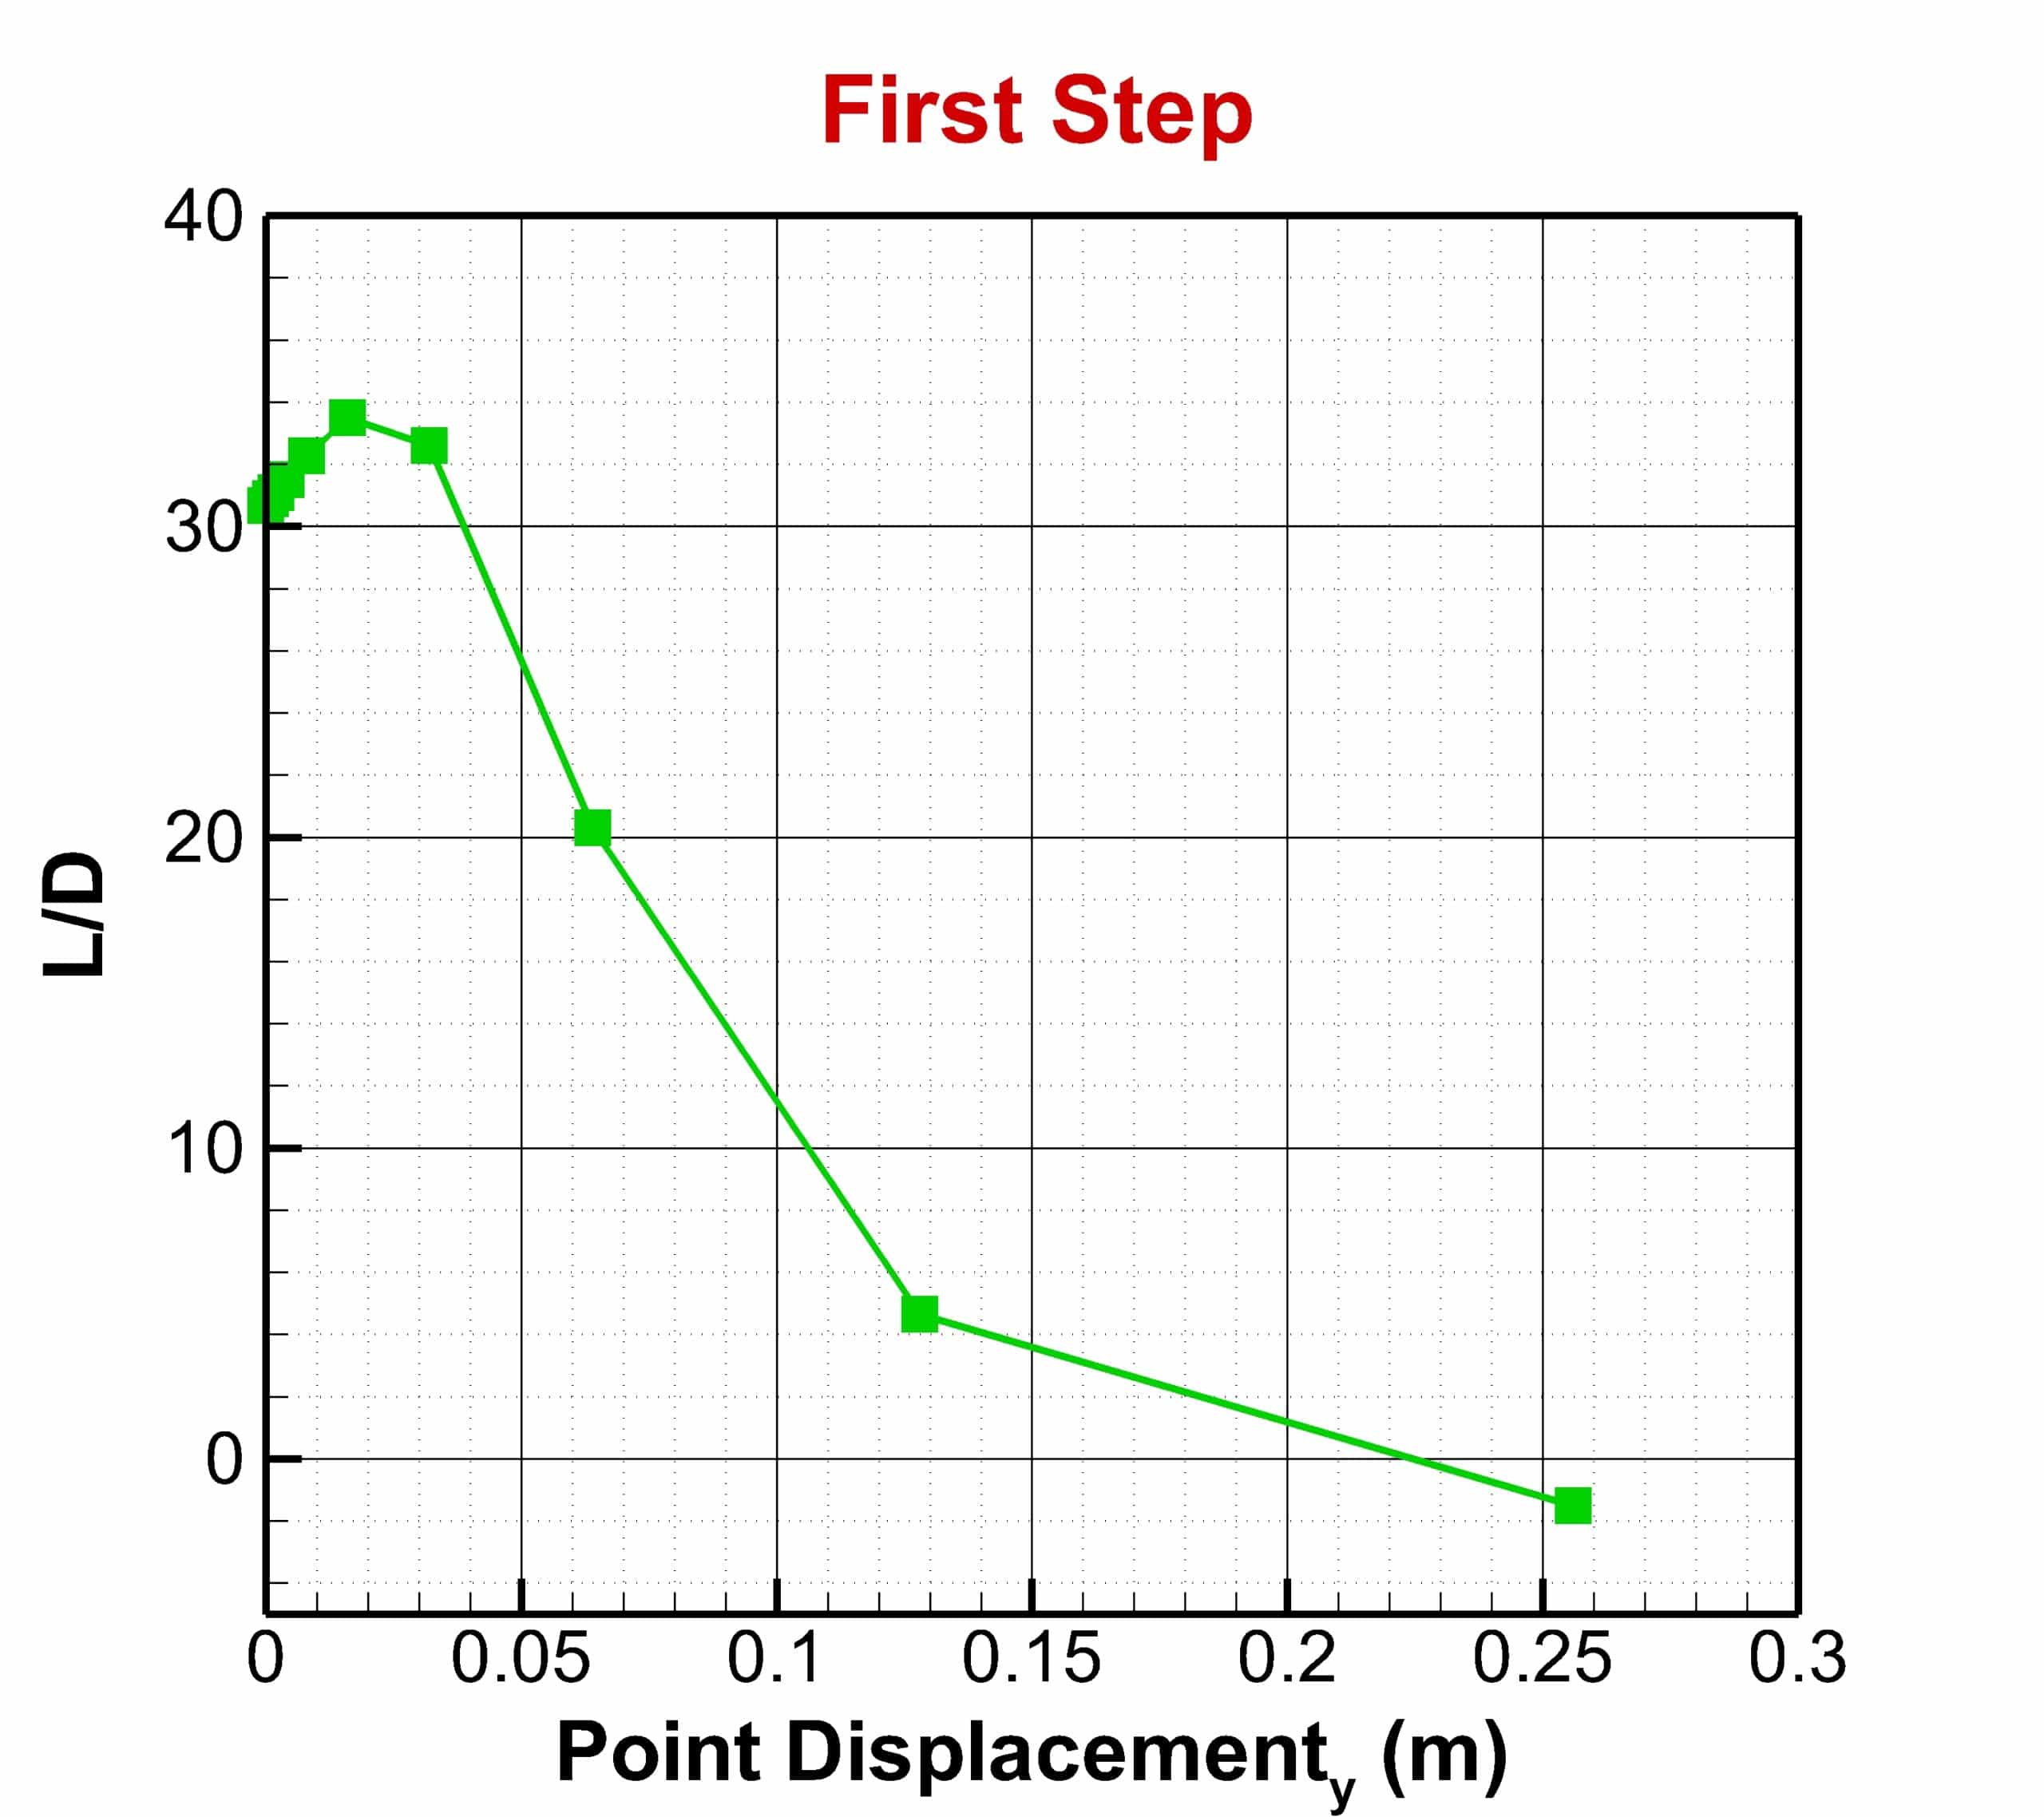
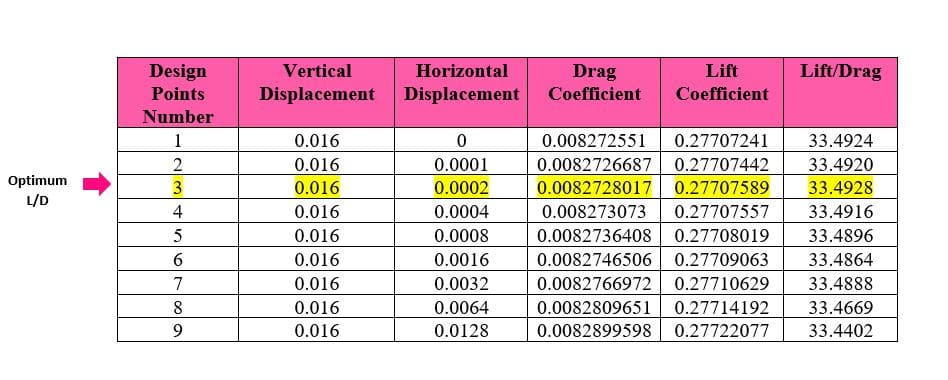
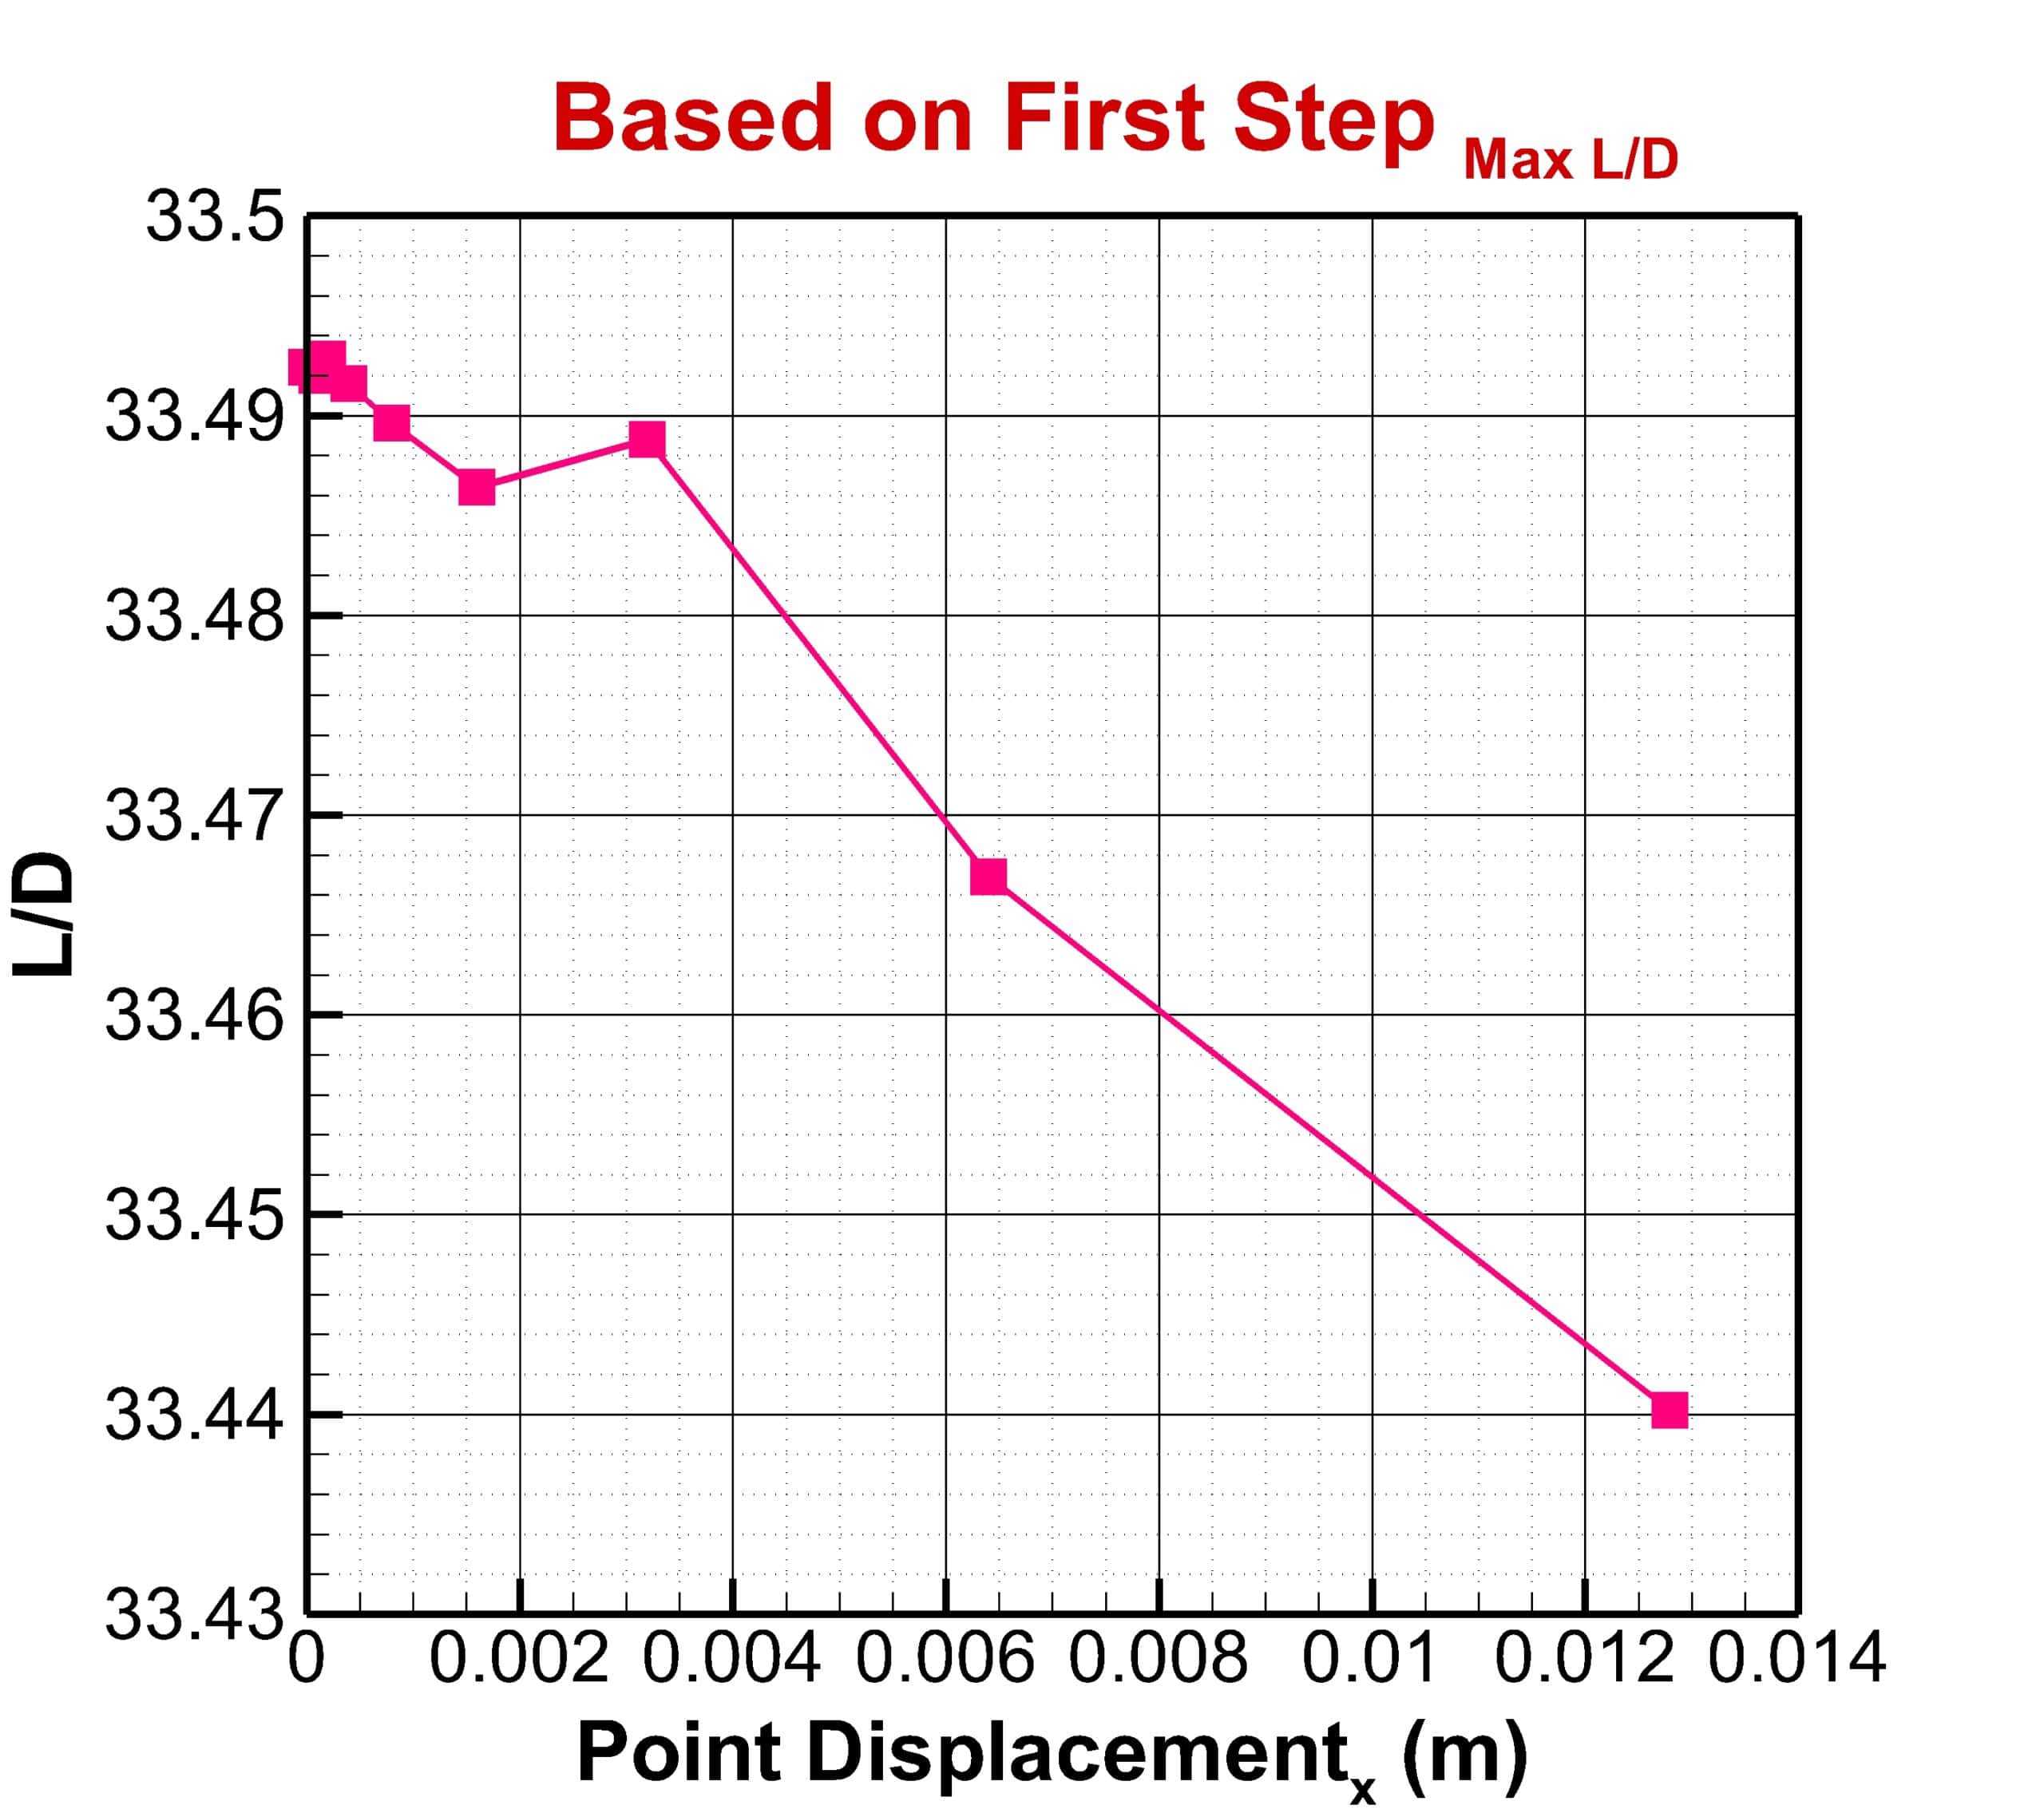
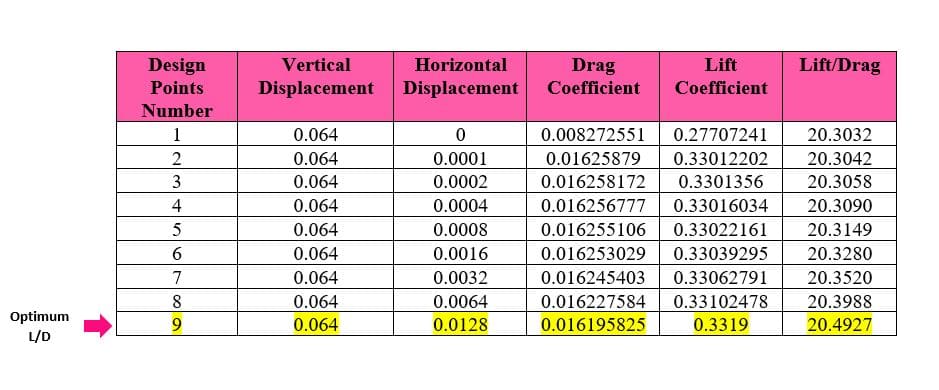
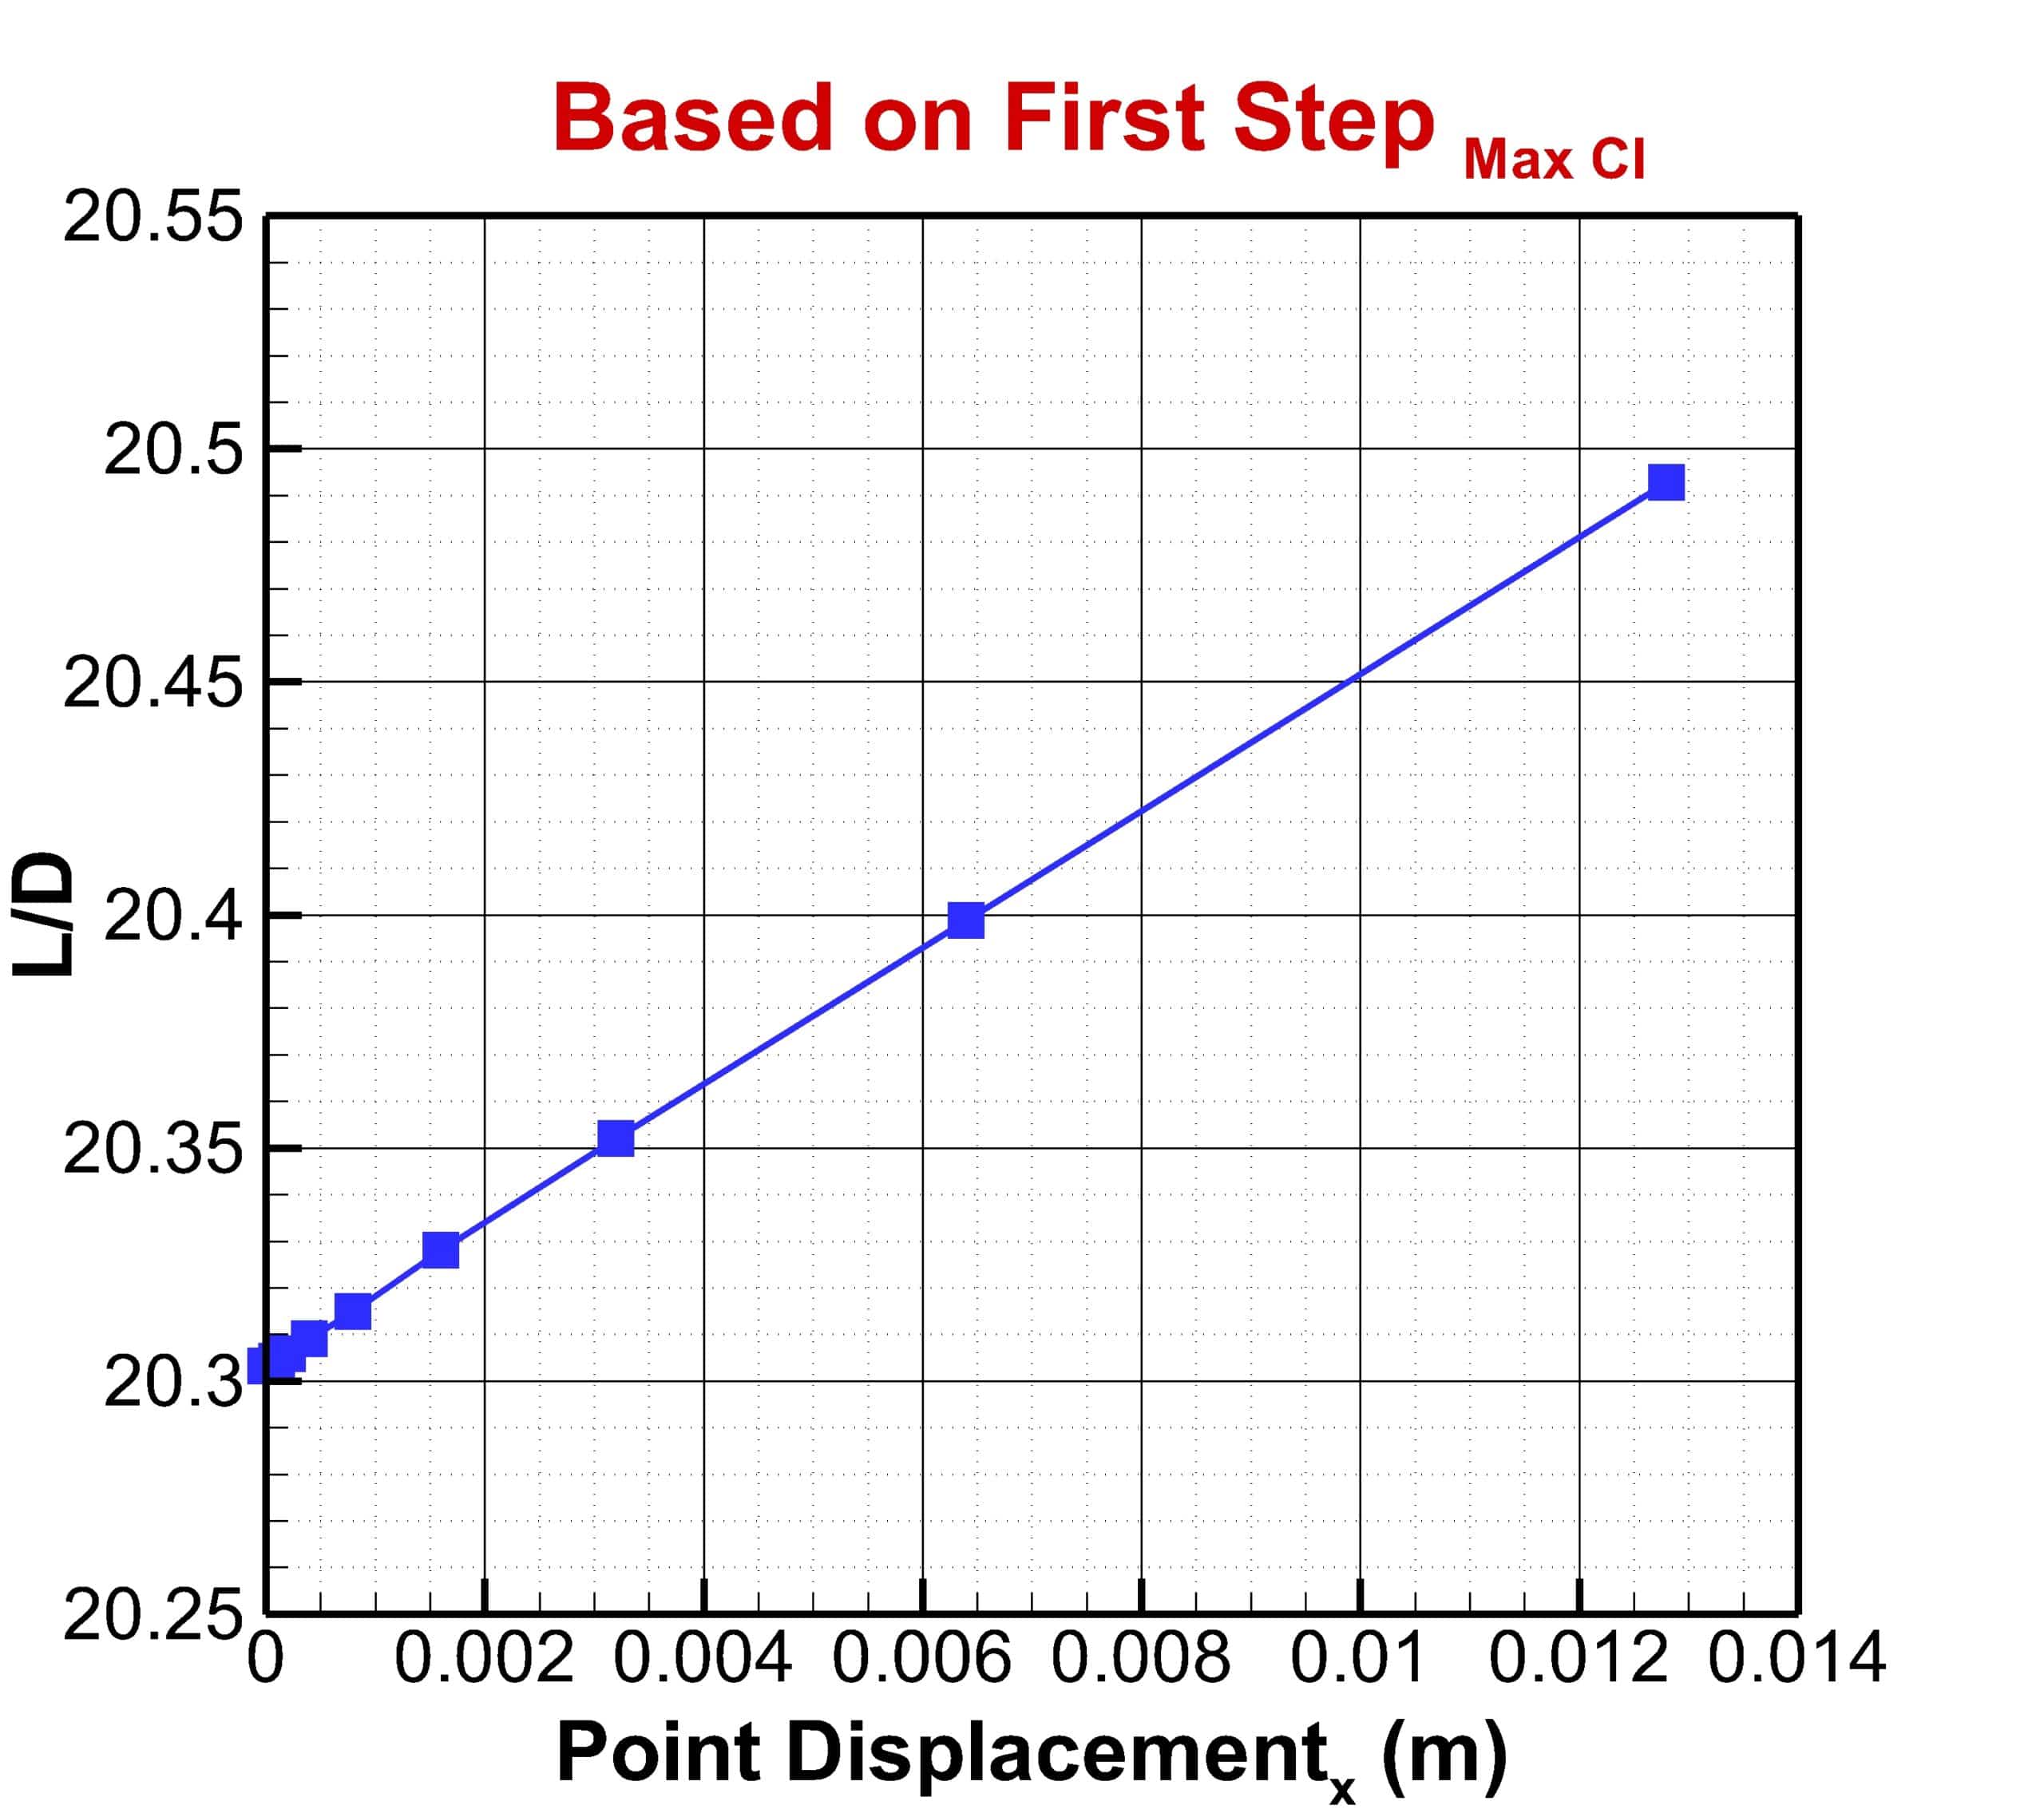
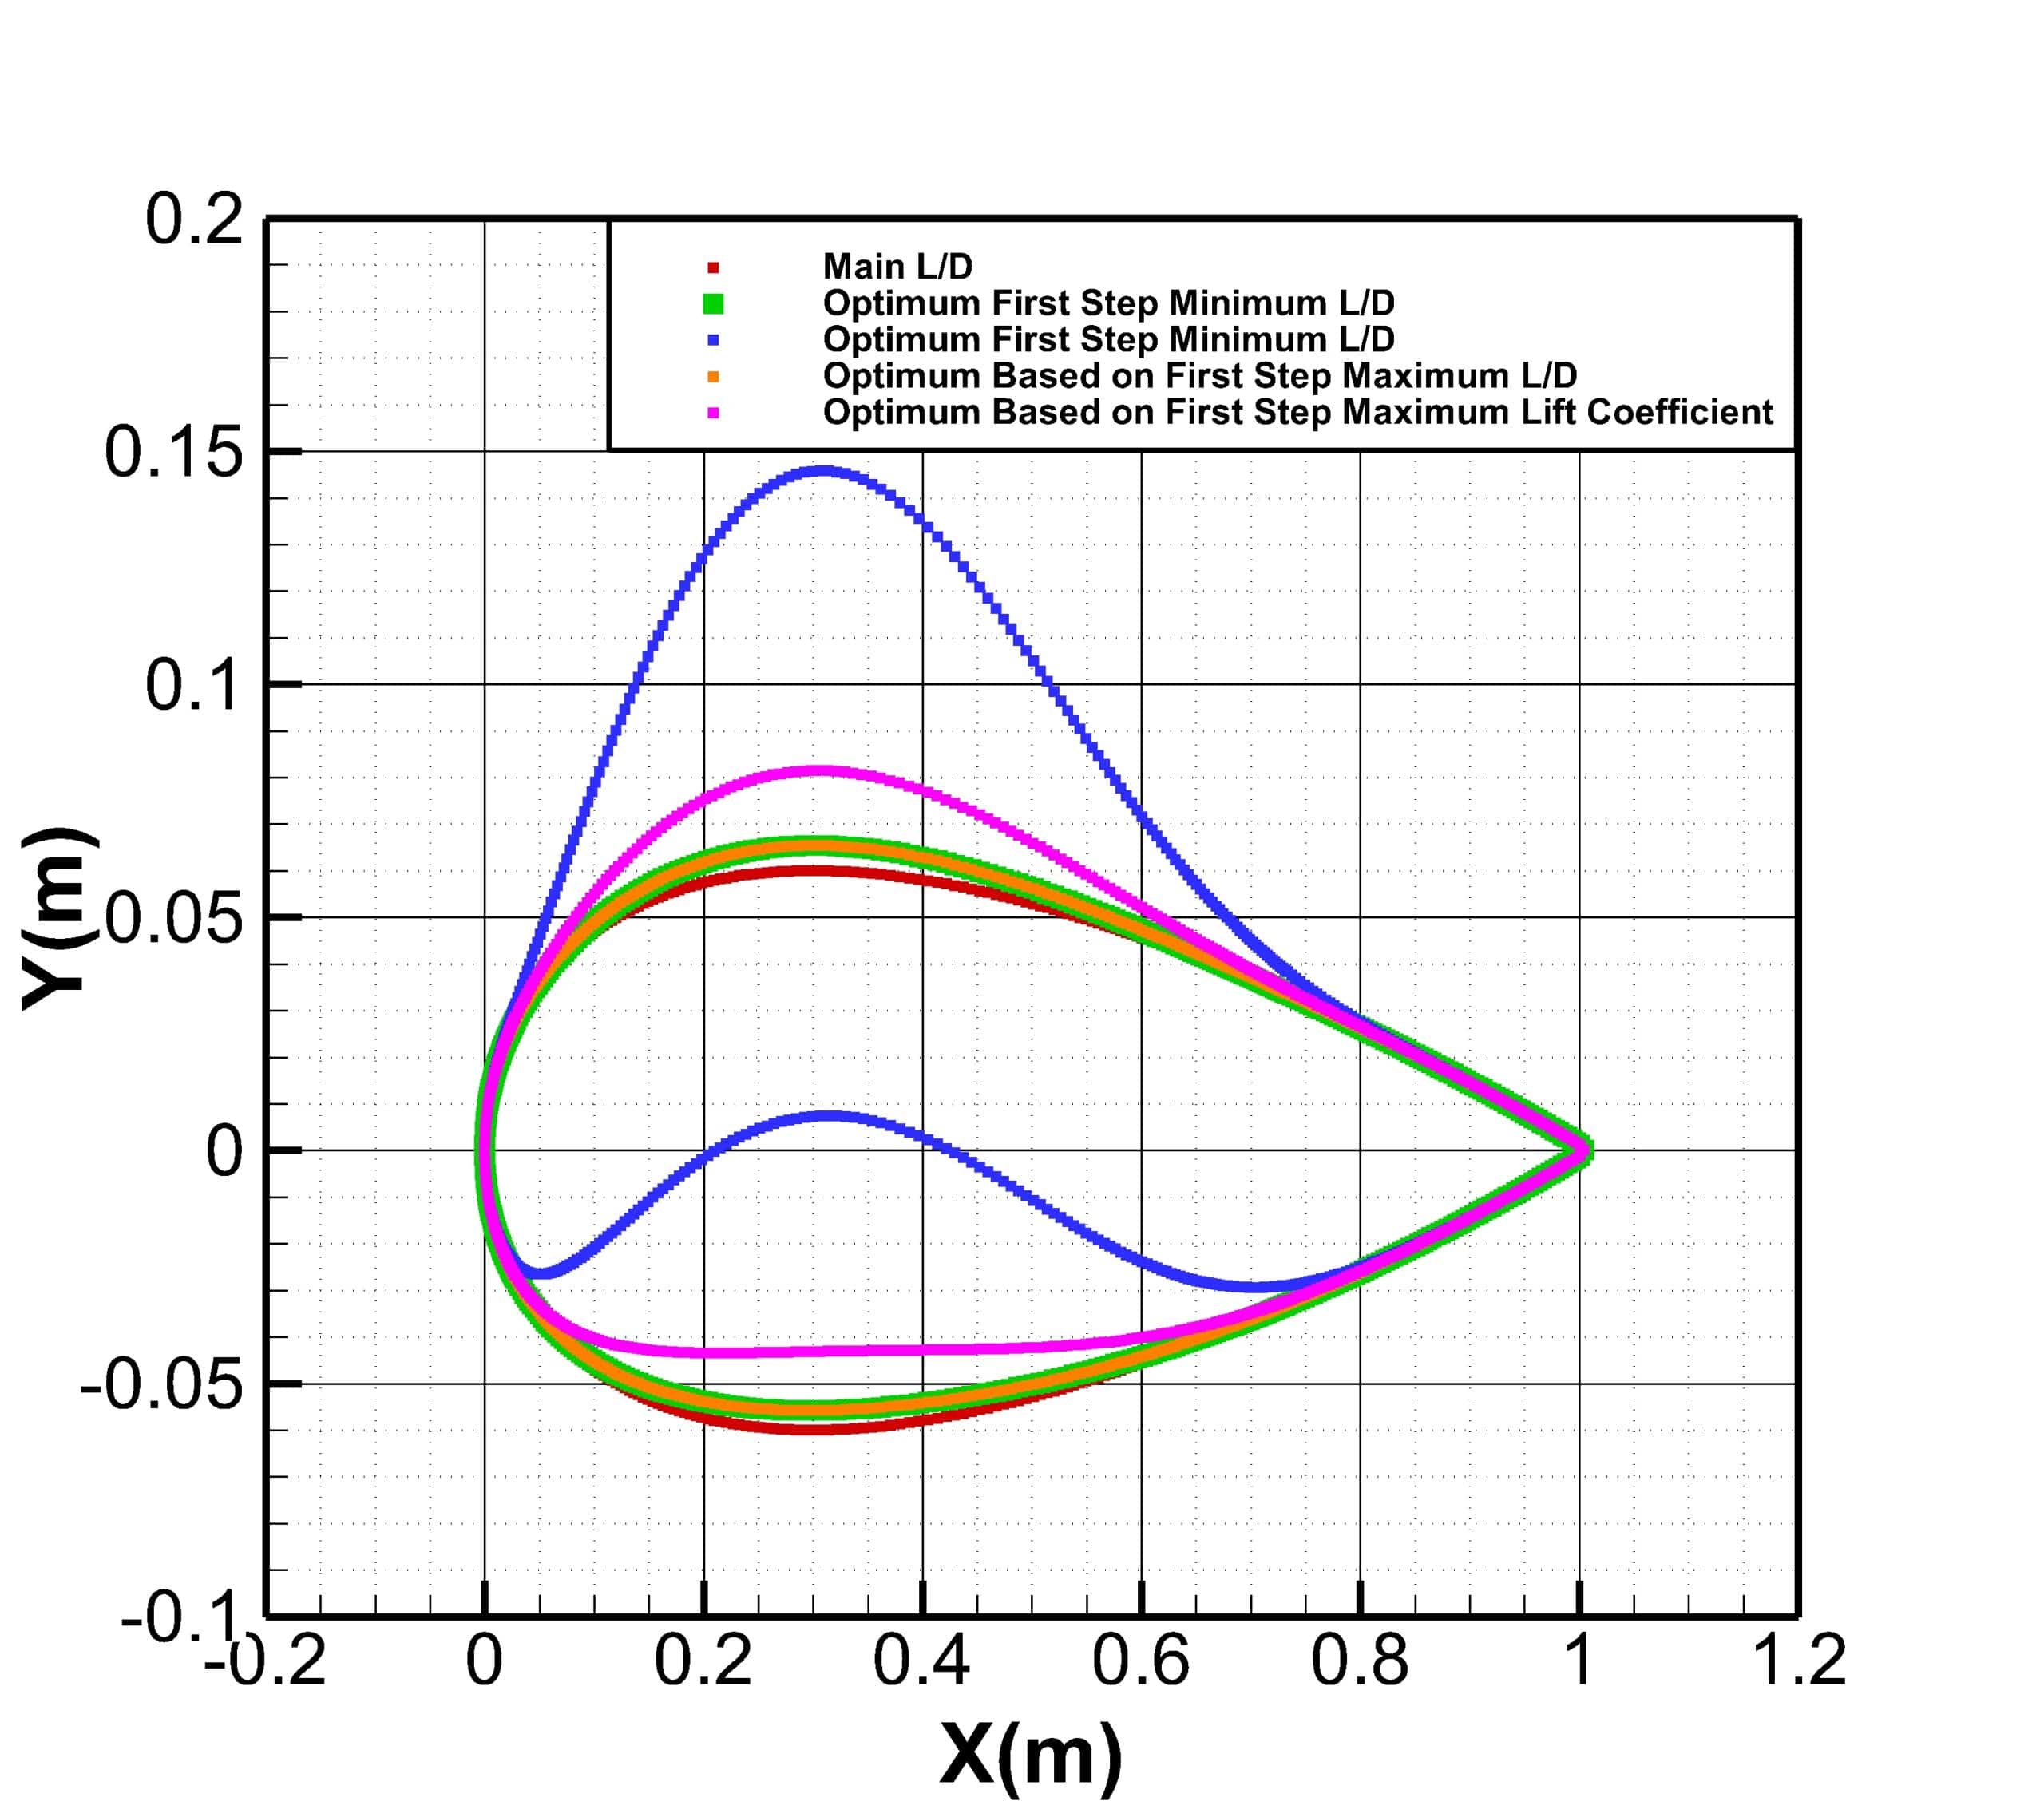
The optimization step is performed in three stages. In the first stage, only the displacement of points in the vertical direction was considered, and the best answers were obtained for the maximum lift-to-drag ratio and maximum lift coefficient. Then in the next step, each of these two optimal solutions was considered for horizontal displacement, and the lift-to-drag ratio was obtained in two new modes.
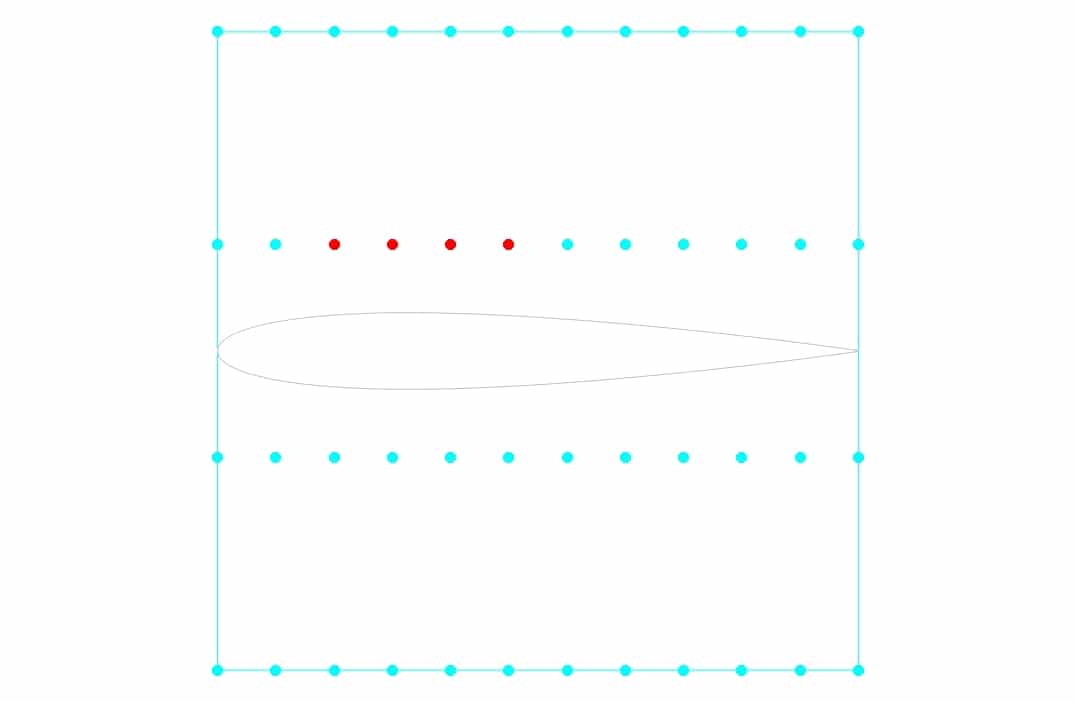
For this purpose, an area is defined around the airfoil, the center of which is (0,-0.5), with the regular control point distribution. The update from the zone is set for the airfoil walls, and this wall’s constraint type is set to unconstrained type. The length and the height of this rectangle are 1 meter. The number of nodes in the X-direction is 12, and the number of nodes in the Y-direction is 4. In fact, the input parameter for this optimization is the vertical and horizontal displacement of these points.
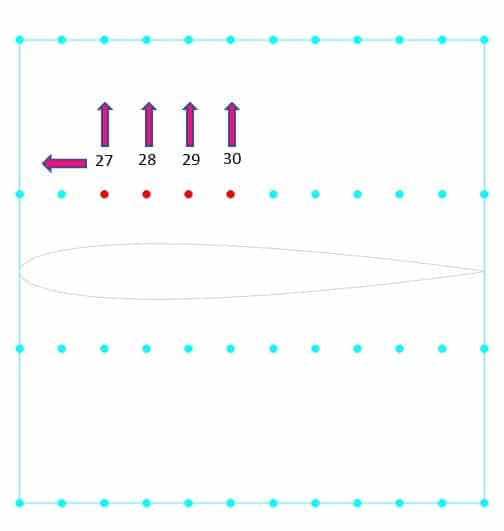
The constraint for another boundary (Farfield) is set to fix. To begin the optimization process, you have to define the motion for each of these points. In this project, for points numbers, 28,29, and 30, the displacement to the +y is considered, and for point 27, the displacement to both -x and +y directions is considered. In the first stage, no horizontal displacement is considered, and the optimal result is obtained only based on vertical displacement. Then, in the next step, based on the best answer of the lift and drag ratio, the amount of vertical displacement is selected. Horizontal displacement is then applied and optimized for vertical displacement to obtain the best lift-to-drag ratio. This optimization has been done once for the best lift coefficient. Finally, the results are compared.
Geometry & Mesh
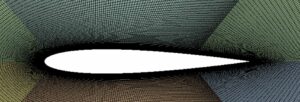
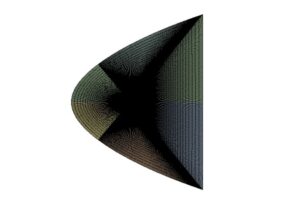
The geometry is designed by the Design Modeler Software, and the meshing of this model has been generated by Ansys Meshing software. The grid type is structured and the total cell number is 73320.
NACA0012 Airfoil CFD Simulation
To simulate the present model, several assumptions are considered, which are:
- The solver is density-based due to compressibility.
- Simulation has been done as steady-state.
- The gravity effect has been neglected.
The following is a summary of the steps for defining the problem and its solution:
| Models | ||
| Viscous | Spalart Allmaras | |
| Spalart Allmaras Production | Strain/Vorticity-based | |
| Boundary conditions | ||
| Farfield | Mach Number | |
| Pressure Fairfield | 0.7
X-component of flow direction: 0.9996435 Y-component of flow direction: 0.02670036 |
|
| Airfoil Up & Airfoil Bottom | Wall | |
| Wall motion | Stationary Wall | |
| Shear Condition | No-slip condition | |
| Methods | ||
| Formulation
Flux type |
Implicit
Roe-FDS |
|
| Flow & Modified turbulent viscosity | Second-order upwind | |
| gradient | Green Gauss Node-based | |
| Initialization | ||
| Initialization methods | Standard | |
| Compute from | Far-field | |
| Material | ||
| Material properties | ||
| density | Ideal gas | |
| viscosity | Sutherland | |
| Cp | 1006.43 | |
NACA0012 Airfoil Optimization Results
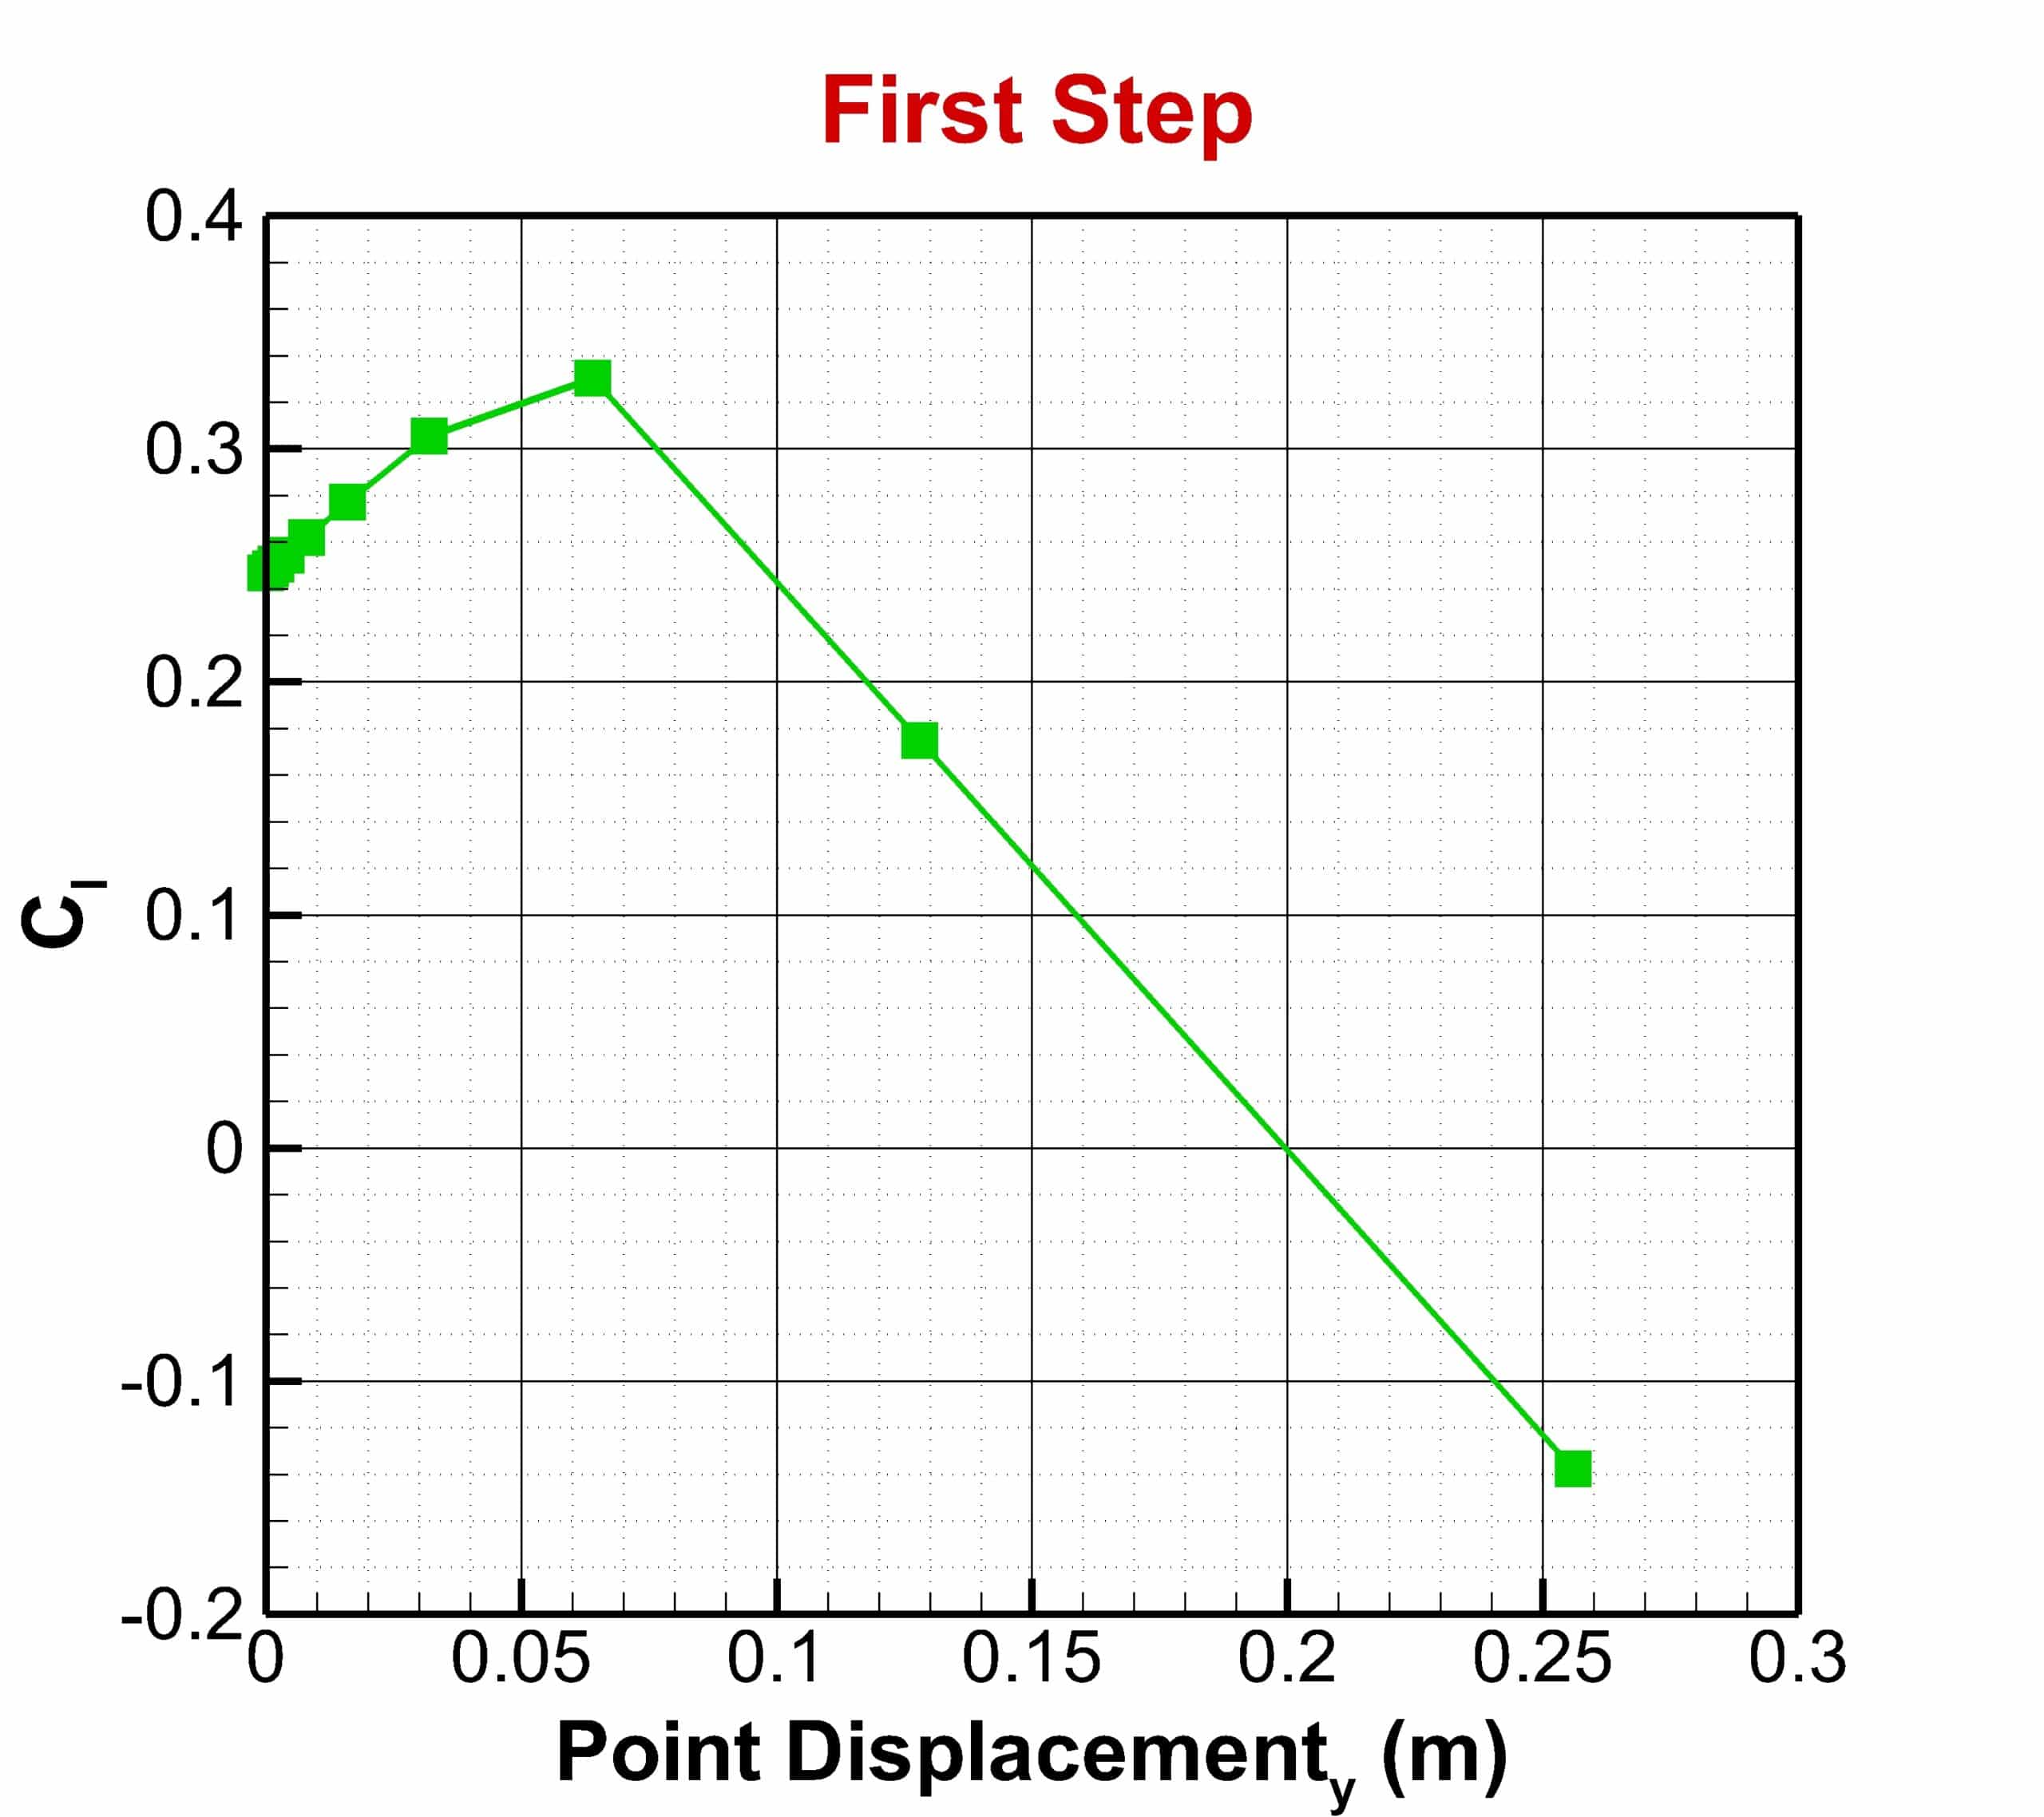
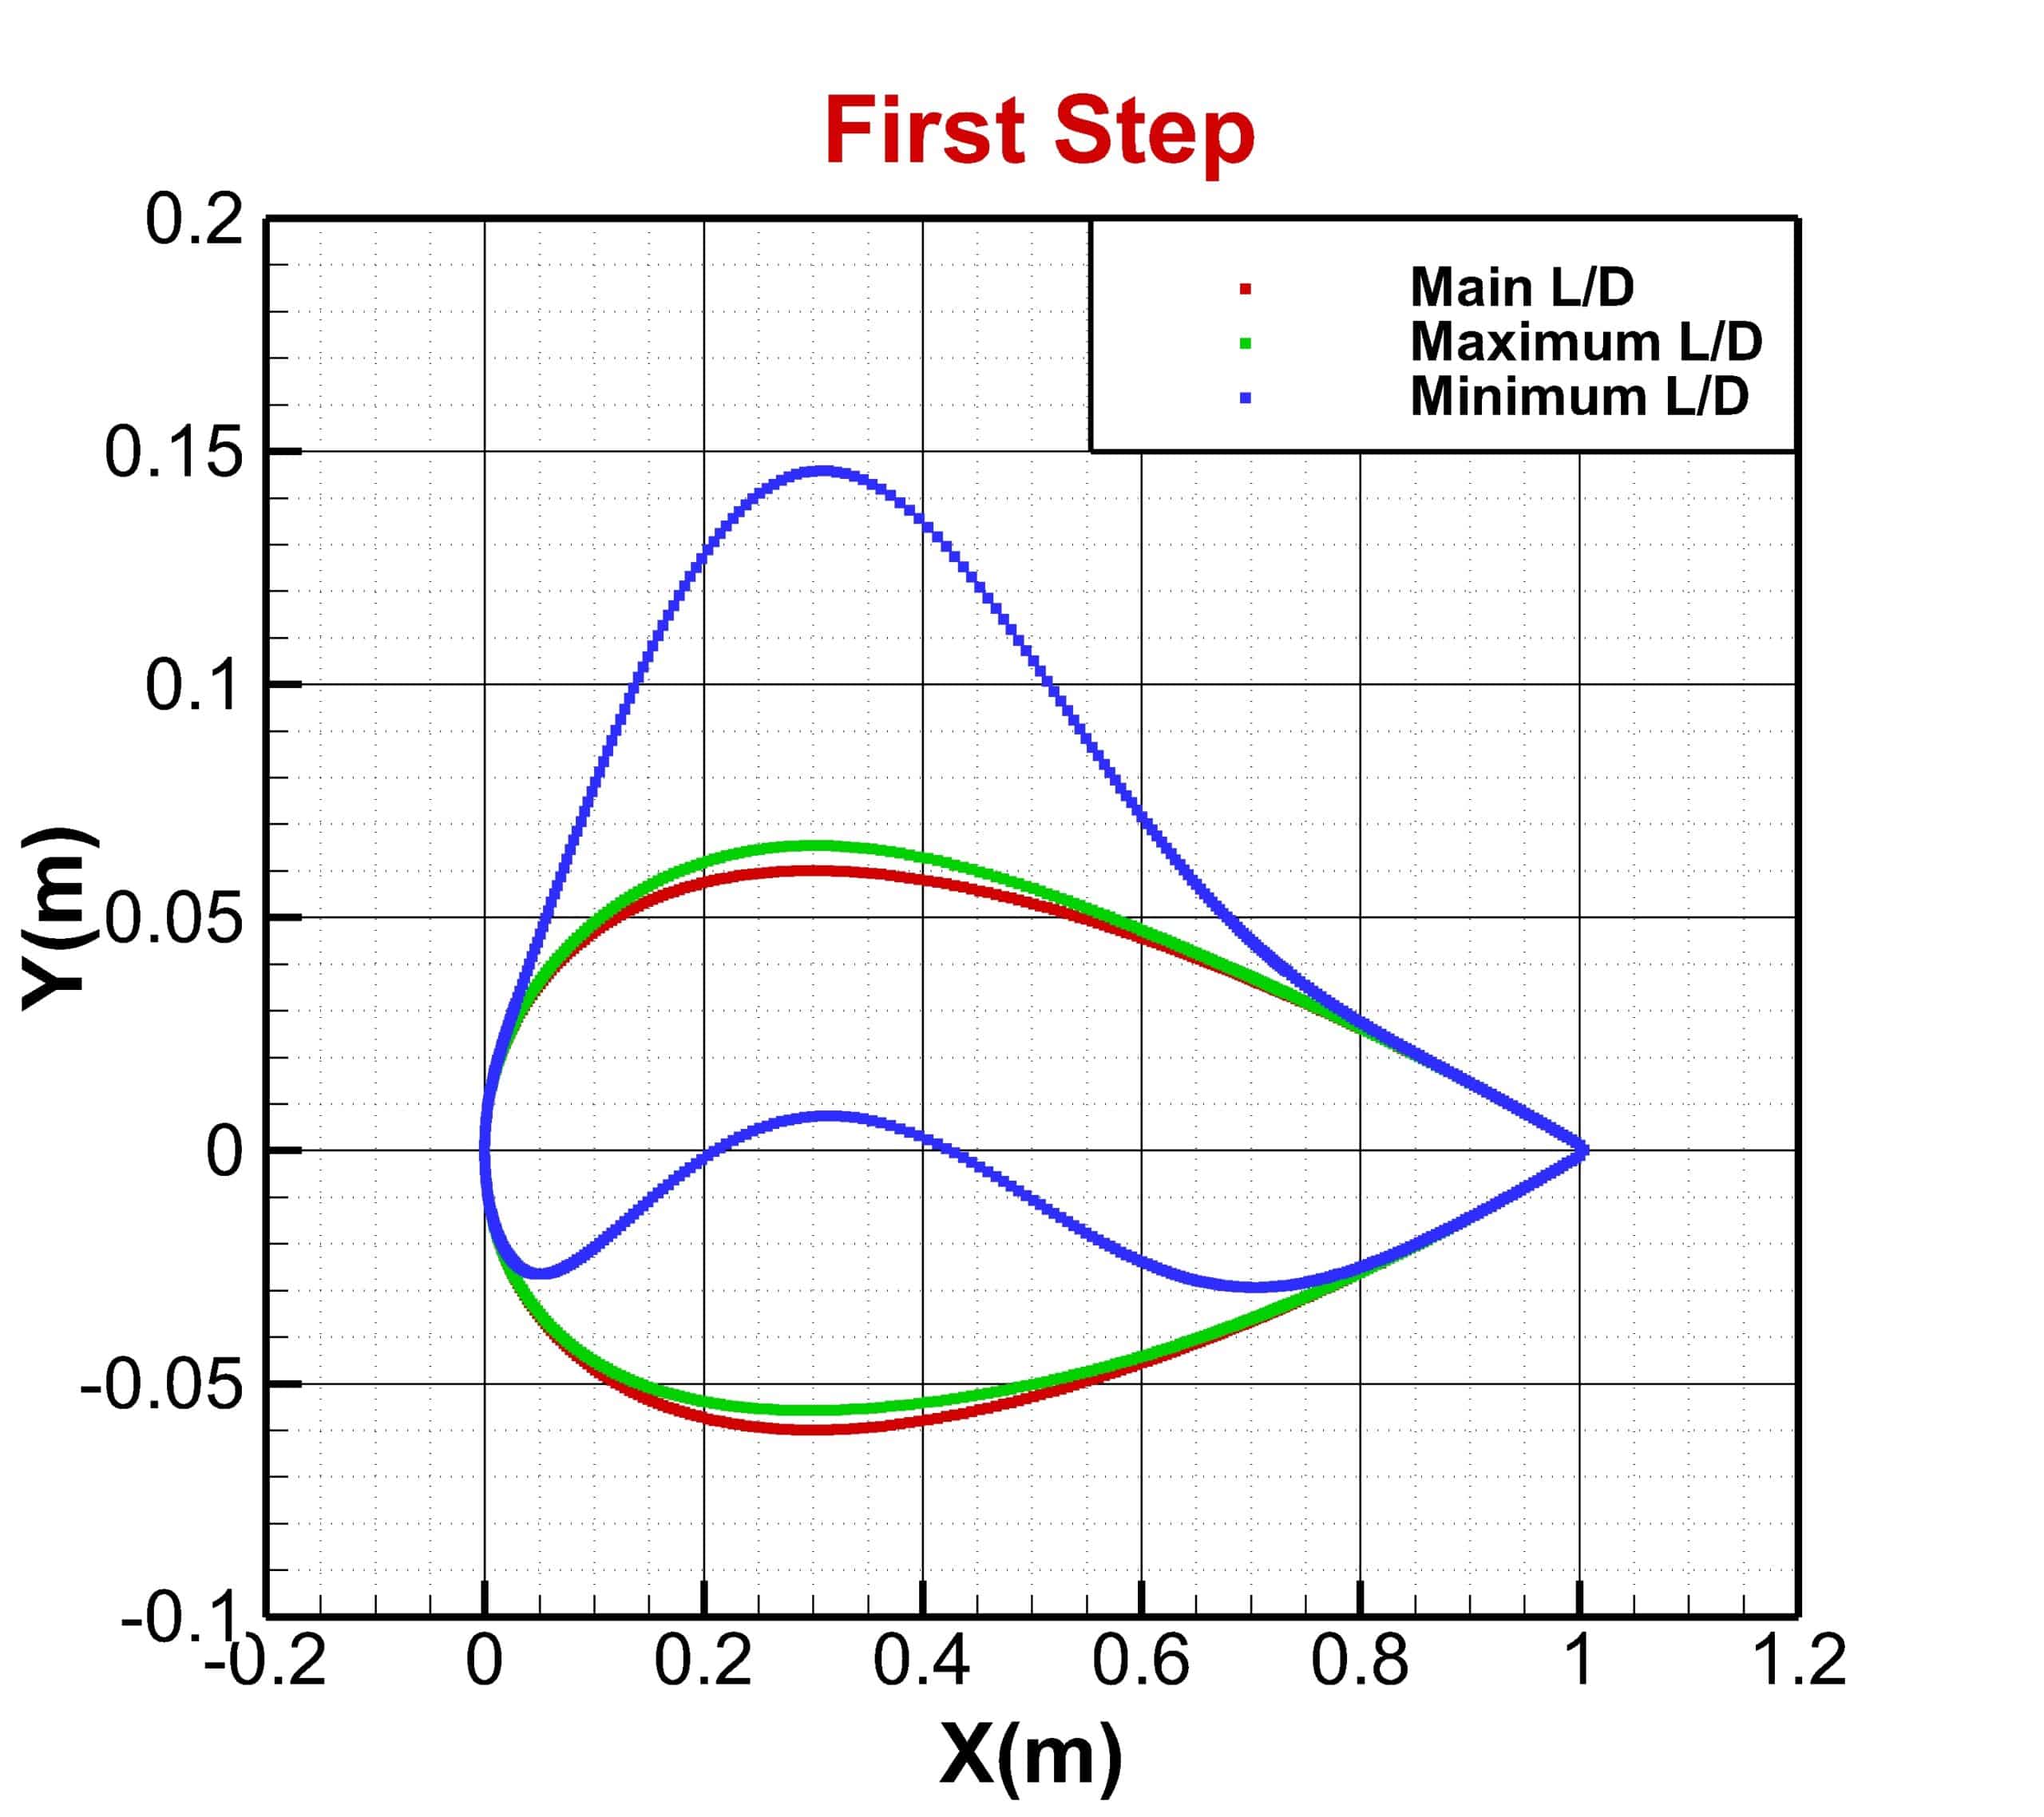
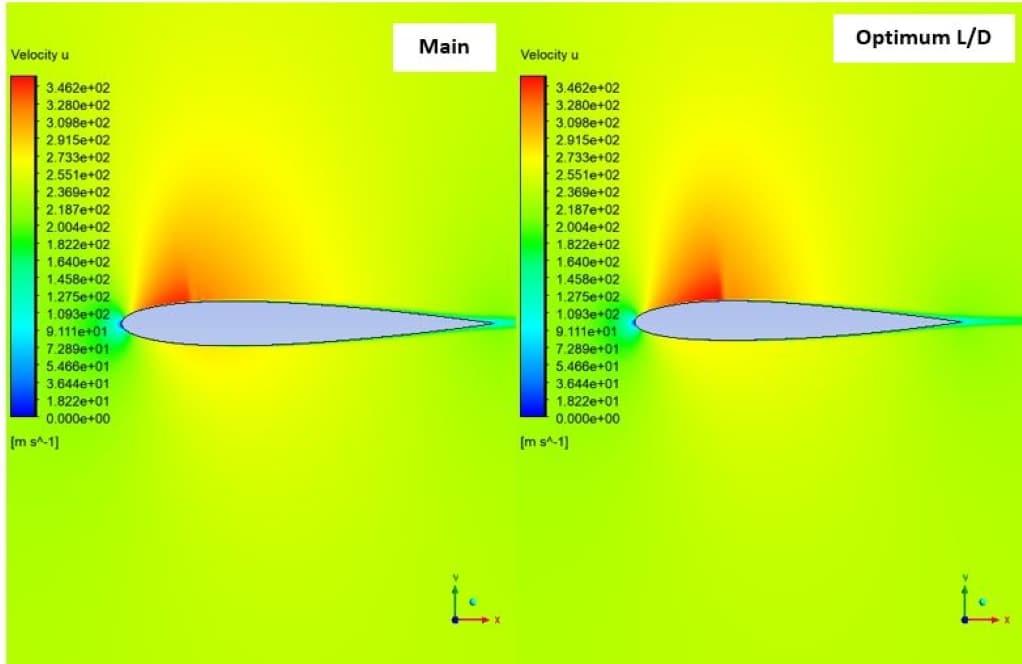
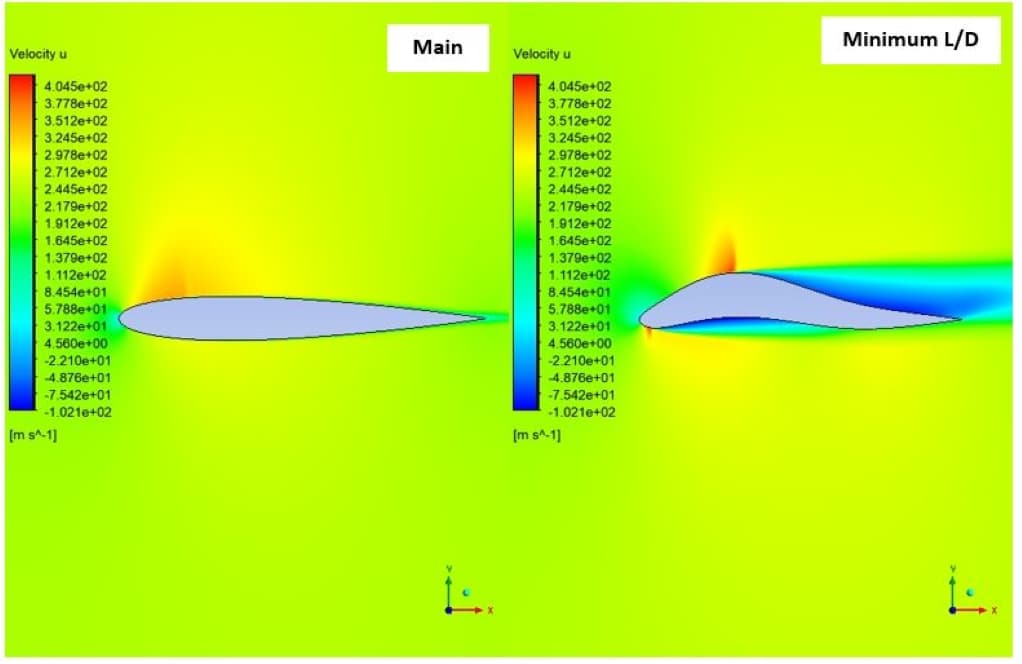
First Step Optimization
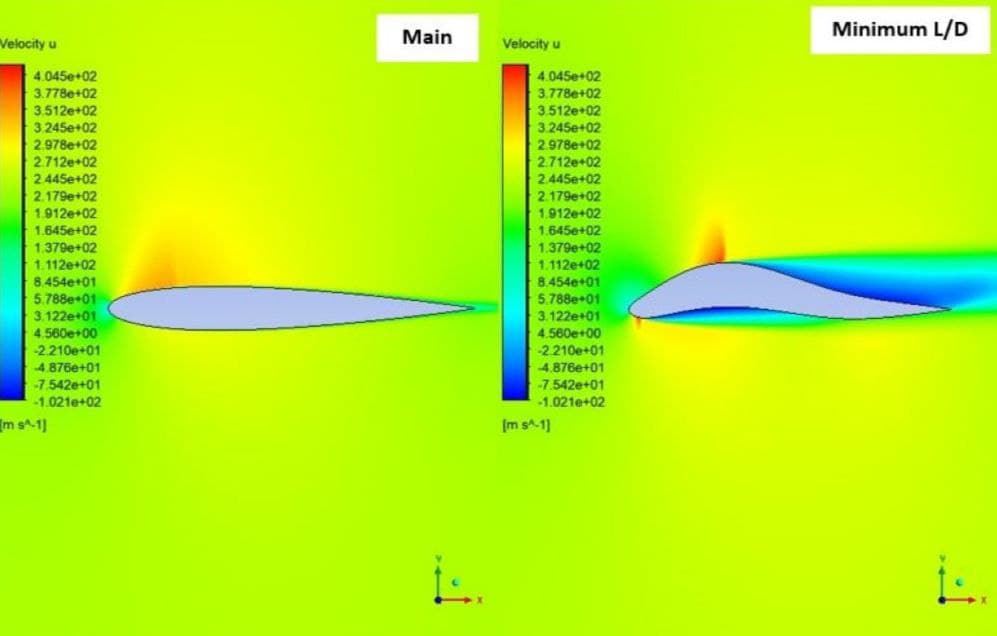
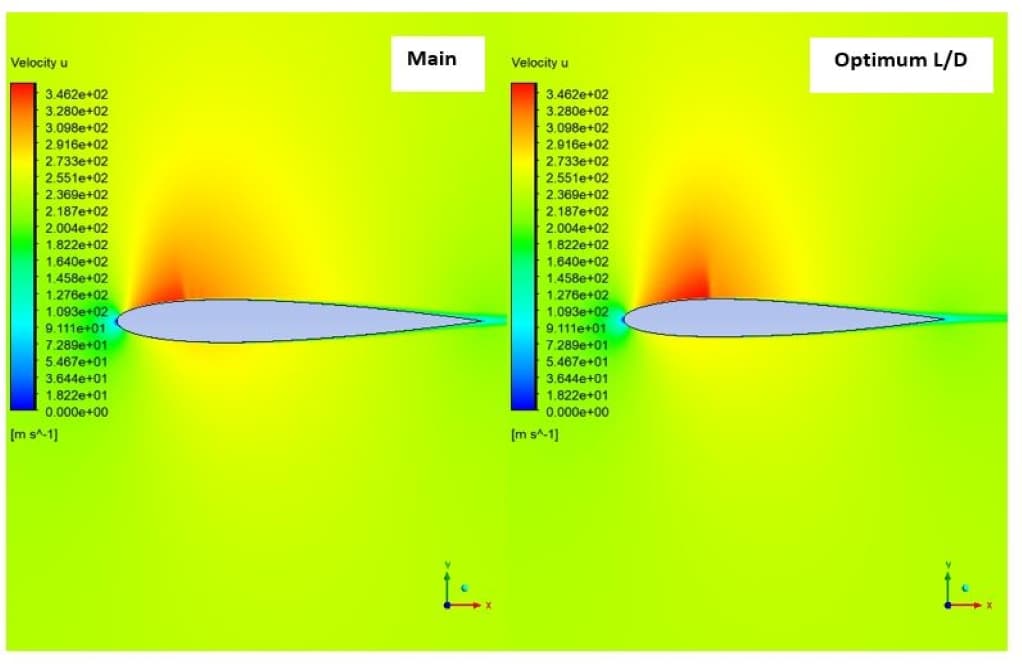
In the second case, the shock is observed on the upper surface of the airfoil, which is almost a normal shock. As it is known, after this shock, the flow velocity has suddenly decreased, which has intensified the separation in this area. On the other hand, due to the concavity created in the lower surface of the airfoil, the difference between the forces of the upper and lower levels of the airfoil has caused a negative lift.




Russell Welch –
The results from the NACA0012 Airfoil Optimization using RBF Morph in Ansys Fluent look impressive. It seems like the optimization process resulted in significant improvements in lift-to-drag ratios while also delaying flow separation and controlling shock. The use of structured meshing with a high number of cells should have provided greater precision in capturing the flow dynamics. It’s great to see comprehensive evaluation at each step, ensuring that each modification leads to tangible aerodynamic benefits.
MR CFD Support –
Thank you for your positive feedback on the NACA0012 Airfoil Optimization project! We are glad to hear that you appreciate the detailed analysis and results brought about by using structured meshing and careful assessment at each iteration. Ensuring accuracy and the effectiveness of aerodynamic optimizations is a top priority for us, and it’s rewarding to see our efforts validated by your experience. If you have any further questions or need more information on similar topics, feel free to reach out to us.
Elwin Brekke –
The thorough CFD analysis provided on the airfoil is both insightful and understandable. The optimization process outlined across the three different stages has been particularly informative. It’s clear the painstaking efforts made to incrementally improve the airfoil’s performance by fine-tuning both vertical and horizontal displacements. The depth of explanation on both the technical aspects of the simulation and meshing approach is commendable.
MR CFD Support –
Thank you very much for taking the time to provide such positive feedback on our NACA0012 Airfoil Optimization training. We are delighted to hear that you found the detailed analysis informative and understandable. It’s truly encouraging to know that our efforts to accurately demonstrate the optimization process were beneficial. Your acknowledgement of the technical complexities involved in the simulation and meshing aspects means a lot to us!
Prof. Sean Flatley DDS –
The NACA0012 Airfoil optimization training was masterfully prepared. The systematic approach from initial CFD simulation to step-wise optimization with thorough explanations provided clear insights into the process. It was informative to see the influence of geometry changes on the lift-to-drag ratio and how even minimal adjustments can lead to significant aerodynamic improvements.
MR CFD Support –
We are thrilled to hear that our NACA0012 Airfoil Optimization training with RBF Morph in Ansys Fluent was helpful and educational for you. Your understanding and appreciation of the detailed steps in the optimization process and the influence of geometry adjustments on aerodynamics mean a lot to us. Thank you for taking the time to share such a thoughtful review!
Marco Turner PhD –
This project was such a comprehensive study! I appreciated how each optimization step was thoroughly investigated. However, I’m curious – after the vertical displacement optimization, what was the specific rationale behind considering the horizontal displacement in the next stage?
MR CFD Support –
The primary purpose of considering horizontal displacement in the subsequent stage of optimization was to further improve the aerodynamic efficiency. After achieving improved results from vertical displacement, exploring horizontal displacement allows for a more nuanced refinement of the airfoil shape to potentially find even better lift-to-drag ratios. This multi-dimensional approach aims to comprehensively optimize the airfoil’s profile for maximum aerodynamic performance.
Prof. Emery Kutch –
The detail in the NACA0012 Airfoil Optimization review is superb. The progression through each simulation stage is methodically presented and gives tremendous insight into the optimization process. This provides clarity on how each step contributes to improved aerodynamic efficiency through alterations in vertical and horizontal displacement. Impressive work!
MR CFD Support –
We greatly appreciate your thorough and positive review. It’s fantastic to hear that the detailed explanation of our NACA0012 Airfoil Optimization process has provided valuable insights. Our commitment to presenting a comprehensive and educational experience has been recognized, and we thank you for acknowledging our efforts!
Dell Greenholt –
I’m so impressed with how the NACA0012 airfoil optimization CFD simulation project improves aerodynamic efficiency! The detailed analysis and clear explanation of each optimization step just had me hooked. Using the combination of vertical and horizontal displacements to enhance the lift-to-drag ratio showcases a thorough understanding of aerodynamics and computational fluid dynamics. Magnificent job on the clear visuals and explanations. Kudos to the MR CFD team!
MR CFD Support –
Thank you for your positive feedback! We’re thrilled to hear that our detailed explanation and analysis of the NACA0012 airfoil optimization project were helpful and engaging. It is gratifying to know that the visuals and steps taken to improve the aerodynamics were appreciated and understood. Your satisfaction with our learning product is extremely important to us, and we look forward to providing you with equally beneficial simulations in the future. If you have any more questions or need further clarifications, feel free to ask. Thanks again for your support!
Andy Kshlerin –
This course far exceeded my expectations! The depth of content and practical application through the optimization of the NACA0012 Airfoil using ANSYS Fluent clearly elucidated the intricate processes of aerodynamic efficiency improvement. Especially impressive was the stepwise approach to optimizing lift-to-drag ratio with vertical and horizontal displacement considerations.
MR CFD Support –
We are thrilled to hear about your positive experience with our NACA0012 Airfoil Optimization course! Thank you for acknowledging the structured approach to teaching complex aerodynamic optimization techniques. Your satisfaction as a learner is our top priority and we’re glad we could exceed your expectations. We appreciate your compliments and look forward to providing you with more rewarding learning experiences in the future.
Dr. Antonio Kling IV –
I appreciate the comprehensive breakdown of the airfoil optimization process, especially the clear steps and considerations detailed for each optimization stage. The project effectively combines theoretical knowledge with practical CFD application, resulting in valuable insights for aerodynamic efficiency improvement.
MR CFD Support –
Thank you for your kind words and for recognizing the depth of our training material on NACA0012 Airfoil Optimization with RBF Morph in ANSYS Fluent. We are thrilled to hear that you found the information clear and valuable. We constantly strive to provide thorough and practical CFD education, and it’s rewarding to see it appreciated. If you’re interested in further materials or have more specific interests in the field of aerodynamics, please feel free to explore our other offerings.
Prof. Darwin Frami Jr. –
The training material on NACA0012 airfoil optimization with RBF Morph in Ansys Fluent is comprehensive and clear. It captures the complexity of the optimization process in a digestible format. The three-step optimization process is well-illustrated, informing the learner on how incremental adjustments can bring about significant improvements in aerodynamic performance.
MR CFD Support –
Thank you for your positive feedback on our NACA0012 airfoil optimization training! We’re thrilled to hear you found the material comprehensive and the illustration of the optimization steps clear. It is our goal to provide instructional content that enhances learning and understanding of complex simulations. We appreciate your acknowledgment of our efforts.
Leatha Treutel –
The training material is excellent. It was especially fascinating to see how well-defined methodologies and systematic optimization steps led to improved aerodynamic performance of the NACA0012 airfoil. Viewing the results of the simulations gave a clear understanding of how the airfoil shape adjustments affect the flow behaviors and ultimately the lift-to-drag ratio.
MR CFD Support –
We’re thrilled to hear you found the training material on optimizing the NACA0012 airfoil informative and insightful. It’s great to know the content effectively demonstrated the impact of shape modifications on aerodynamic efficiency. Thank you for your positive feedback!
Coby Ortiz Jr. –
I found the utilization of both the Spalart Allmaras model for viscosity and Roe-FDS for the flux type particularly interesting in the NACA0012 airfoil optimization simulation. Can you explain more about the benefits of using these specific methods in the context of airfoil optimization?
MR CFD Support –
These methods are chosen for their specific advantages in computational fluid dynamics simulations. The Spalart Allmaras turbulence model is computationally less expensive than other models and provides accurate results for aerospace applications, particularly where wall-bounded flows are concerned. Roe’s Flux Difference Splitting (Roe-FDS) is used as it is capable of accurately capturing shock waves which can frequently occur around airfoils at high speeds. Together, they deliver a balance of efficiency and precision in predicting the flow characteristics necessary for optimizing the NACA0012 airfoil’s performance.
Twila Thiel –
The optimization results are incredible! Fantastic to see computational fluid dynamics being used to fine-tune airfoil geometry. The meticulous detail in every step is commendable.
MR CFD Support –
Thank you for your positive feedback! We’re delighted to know that the depth of analysis and optimization of the NACA0012 airfoil using CFD captivated your interest. Our team works hard to ensure accuracy and detail in all our simulations. Your enthusiasm for our product truly motivates us!
Miracle Gutkowski DDS –
In the first step of the optimization, why is 0.016m chosen as the optimal vertical displacement for the maximum lift-to-drag ratio?
MR CFD Support –
0.016m vertical displacement is identified as the optimal point for the maximum lift-to-drag ratio based on the simulation results that show the highest enhancement in aerodynamic efficiency at this particular displacement. At this vertical displacement, the geometry of the airfoil is modified in a way that increases the lift force while maintaining a drag force that results in the highest lift-to-drag ratio received in the simulations that have been run. Aerodynamic properties such as flow pattern changes, differences in pressure distribution, and delayed flow separation contribute to the optimization at this defined point.
Mr. Darrion McCullough Sr. –
After completing the NACA0012 airfoil optimization, what improvement was observed in terms of aerodynamic efficiency compared to the original airfoil design?
MR CFD Support –
Thank you for the top-notch article! Utilizing RBF Morph optimization led to remarkable enhancements in aerodynamic efficiency, with significant lift-to-drag ratio increases under various defined vertical and horizontal displacements, thus optimizing the airfoil’s performance. Coupling such precise computational fluid dynamics analyses with advanced optimization techniques made a substantial difference in the operational aptitude of the NACA0012 airfoil. It’s exciting to see numerical simulation wield such an impact on design refinement!
Destiney O’Connell –
I’m thrilled with the depth of analysis provided in the NACA0012 Airfoil Optimization training. It’s fascinating to witness the nuanced adaptations leading to tangible aerodynamic improvements. Definitely looking forward to applying these insights into my own simulations.
MR CFD Support –
Thank you so much for your positive feedback! We are glad to hear you found the NACA0012 Airfoil Optimization training insightful. It’s thrilling to know that the training could positively influence your simulation work. Should you have any further queries or need more guidance, feel free to reach out.
Robert Altenwerth –
The project details for the NACA0012 Airfoil Optimization are thorough and enlightening. The step-by-step procedural explanation precisely illustrates how the aerodynamic efficiency was enhanced. A complex concept was made accessible thanks to the clear depiction of the process.
MR CFD Support –
Thank you for recognizing the level of detail in our NACA0012 Airfoil Optimization project explanation. We strive to present complex engineering concepts in an understandable way, and it’s gratifying to know that you appreciate the clarity we provide in our training materials.
Prof. Victor Nader I –
Just completed the NACA0012 Airfoil Optimization training and I’m impressed! The step-by-step optimization process was clearly outlined and the results well explained. It was fascinating seeing how even small modifications can create such a significant impact on the airfoil’s performance. The visuals added a great understanding of the changes in the geometry and the consequences on the flow. Great learning product!
MR CFD Support –
Thank you for your kind words! We’re thrilled to hear that our NACA0012 Airfoil Optimization training was effective and provided clear insights for you. Appreciating the impact of geometry on aerodynamic performance is crucial, and we’re glad the visuals reinforced this. Thank you for choosing our training products, and we look forward to assisting you further in your learning journey!
Mittie Strosin II –
This product was incredibly thorough. The step-by-step breakdown of the optimization process was great and easy to understand.
MR CFD Support –
Thank you for your kind words! We’re delighted to hear that the step-by-step approach was helpful and easy to follow.
Garrick Mohr PhD –
This review was incredibly thorough and informative – I learned a lot! The optimization process was clearly explained and seems very iterative, refining different aspects of the geometry in each stage. The explanation of the solver settings and material assumptions was particularly helpful for understanding the setup. The inclusion of specific details like the structured grid and the solver type shows the depth of consideration in the simulation process. Well done on improving both the lift-to-drag ratio and the lift coefficient!
MR CFD Support –
Thank you for your positive feedback! We’re glad to hear that the detailed explanation enhanced your understanding of the optimization process for the NACA0012 airfoil using Ansys Fluent. We always strive to provide comprehensive information to support and illuminate our simulation approaches. We appreciate your recognition of our efforts to refine aerodynamic efficiency and it’s motivating to see our work being valued. If you have any further questions or need additional details, please don’t hesitate to ask.
Adrianna Thiel –
Wow, it’s incredible how comprehensive and detailed the steps for both the CFD simulation and optimization of the NACA0012 Airfoil have been documented. It clearly shows a systematic approach for increasing aerodynamic efficiency using Ansys Fluent, which is impressive.
MR CFD Support –
Thank you for your kind words! We’re thrilled that you appreciate the hard work that went into the project, and we’re glad it provided a clear illustration of how to use Ansys Fluent for those enhancements. Your feedback is greatly appreciated.
Mrs. Wava Hauck III –
I am absolutely thrilled with the comprehensive results from the three-step optimization process using RBF Morph and the attention to detail! The clear visualizations and the detailed analysis in each step showed a deep understanding of the aerodynamic behavior of the NACA0012 airfoil under various modifications.
MR CFD Support –
We deeply appreciate your positive feedback on the NACA0012 Airfoil Optimization project. Our team is glad that the detailed results, visualizations, and analysis met your expectations. Thank you for recognizing our commitment to presenting comprehensive and thorough CFD studies. If you have any further questions or need assistance with future projects, please don’t hesitate to reach out.