Urban Heat Island (UHI) and Urban Air Quality CFD Simulation on a Real Zone
Original price was: $480.00.$240.00Current price is: $240.00. Student Discount
- In this project, an Urban Heat Island (UHI) has been numerically simulated by ANSYS Fluent.
- Investigating Wind and Thermal Comfort, Considering Solar Radiation.
- Renovation Suggestion for Local Improvement.
- Urban Planning.
To Order Your Project or benefit from a CFD consultation, contact our experts via email ([email protected]), online support tab, or WhatsApp at +44 7443 197273.
There are some Free Products to check our service quality.
If you want the training video in another language instead of English, ask it via [email protected] after you buy the product.
Description
Introduction
The study of Urban Heat Island (UHI) is one of the important issues in the world and is popular among researchers. We investigate these issues using CFD analysis.
Auckland is a large metropolitan city on the North Island of New Zealand. The most populous urban area in the country and the fifth largest city in Oceania.
Auckland lies between the Hauraki Gulf to the east, the Hanau Ranges to the southeast, Manuka Harbor to the southwest, and the Waitakere Ranges. The surrounding hills are covered in rainforest, and the landscape is dotted with 53 volcanic Fields.
Auckland has an oceanic climate. Meanwhile, according to the National Institute of Water and Atmospheric Research (NIWA), its climate is considered subtropical. This city has hot and humid summers and mild and humid winters.
It is the warmest main center of New Zealand. The average daily maximum temperature is 23.7 °C (74.7 °F) in February and 14.7 °C (58.5 °F) in July. The maximum recorded temperature was 34.4 °C (93.9 °F) on 12 February 2009. But, the minimum temperature was −3.9 °C (25.0 °F).
Auckland occasionally suffers from air pollution due to fine particle emissions. There are also occasional breaches of guideline levels of carbon monoxide. While maritime winds normally disperse the pollution relatively quickly, they can sometimes become visible as smog, especially on calm winter days.
The mean high-pressure belt in the New Zealand sector of the Southern Hemisphere is centered near 30° S so that westerly winds predominate over the country.
On a day-to-day basis, however, there is great variability in the pressure distribution. Sometimes intense anticyclones occur in the country’s south with depressions to the north. They cause an easterly flow with the reversal of the usual weather pattern. These blocking situations may be rather persistent. They interrupt the more common westerlies associated with the eastward progression of weather systems.
Urban Heat Island Description
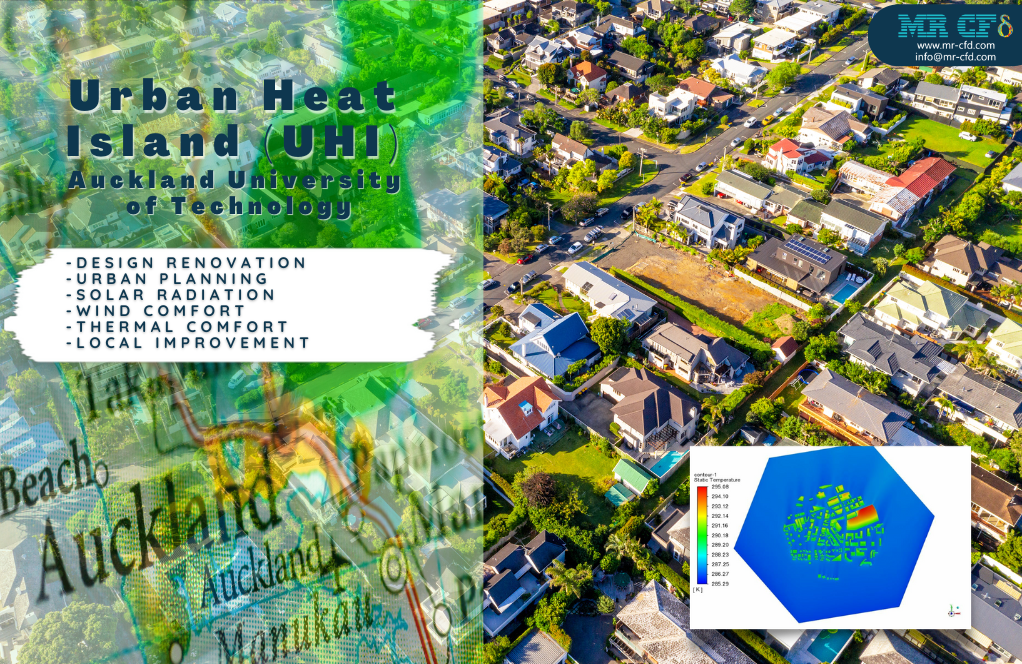
The purpose of this simulation is to observe the effects of ocean winds on urban roads in Auckland city. Thus, we select the urban plan of Auckland University of Technology (UHI) for this issue to investigate.
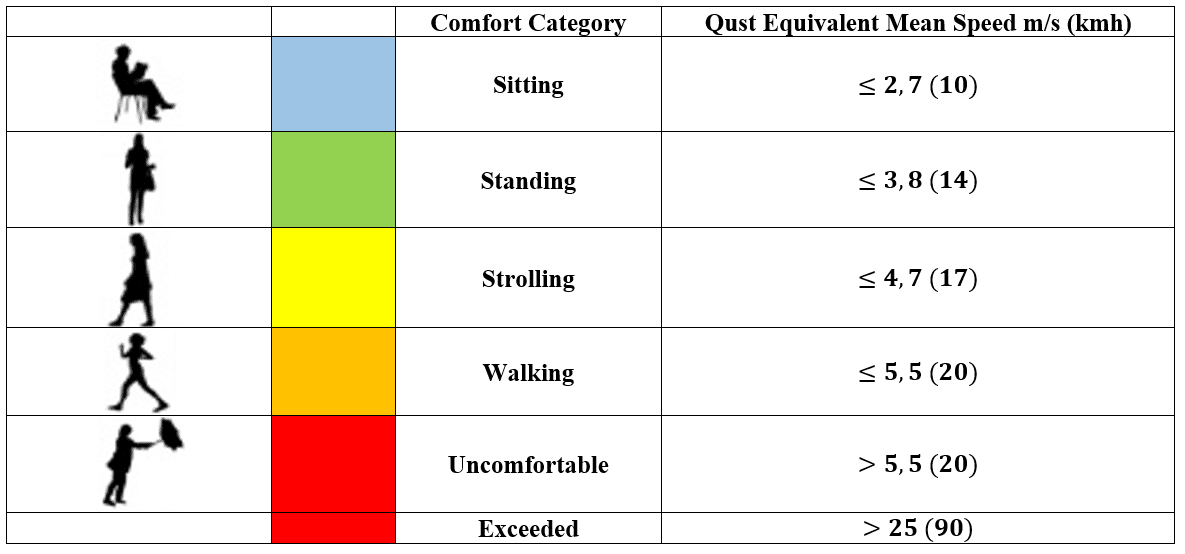
This study aims to analyze wind comfort conditions in the area and find places where wind speed is higher than 3.8 m/s. For thermal comfort analysis, the campus area should have no place with a temperature above 295 K.
All the buildings and structures in the space under consideration were extracted and named with Google earth pro (Fig. 1). With the map of the desired area in hand, the geometry and volumes corresponding to each building were plotted within the ANSYS Design Modeler software.
Figure 1: The exact position of the main domain surrounded by the subdomain
Figure 2: Dimensions of all domains
Wind Comfort
Step 1:
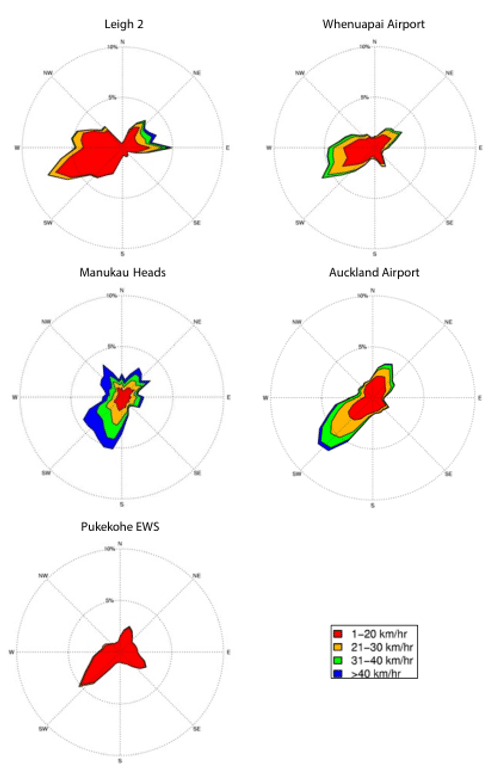
The airflow over Auckland is predominantly from the southwest. This is particularly so in winter and spring, but in summer, the proportion of winds from the northeast increases. This arises from the changing location of the high-pressure belt, which is further south in summer and early autumn than in winter and spring.
In addition, sea breezes add to the proportion of easterlies in eastern areas in summer and early autumn. Figure 3 shows surface wind’s mean annual wind frequencies based on hourly observations from selected stations.
Mean wind speed data (average wind speeds taken over the 10 minutes preceding each hour) are available for several sites in Auckland, illustrating the region’s different wind regimes. Coastal areas (e.g., Auckland Airport) tend to be windier than sheltered inland areas throughout the year.
Figure 3: average wind speeds
Figure 4: average wind speeds
As urbanization grows, more population exists in jam city centers. Wind trouble, or unstable wind conditions, are more significant as an agent for location and structure designs, as these new tall constructions can lead to higher wind velocities and more powerful jet streams at the pedestrian level.
To appraise the pedestrian wind comfort in a specific place for existing or future urban areas, three origins of Historical meteorological data, Local wind conditions, and Specific comfort criteria need to be specified and then incorporated.
There are many basic scales available to assist in recognizing the anticipated wind comfort in the planning step by providing factors of what should be obtained to remain within desirable situations. Any construction, tall towers, short buildings, bridge, or tunnels, will affect its circumambient.
By determining pedestrian wind comfort, municipal employer designers can forecast the wind flow behavior around buildings while they are in the planning step. Considering wind comfort issues is imperative for urban renovations and designs. Figure 5 shows the table of wind comfort for different pedestrian circumstances.
Figure 5: Example of mechanical wind comfort criteria
Figure 6: wind speed 1m from the grand surface (m/s)
Table 1:
The contour of the velocity distribution of wind from southeast to northwest shows that the wind speed around the buildings that are directly exposed to the airflow even reaches 30 km/h at some point (black arrows), and it is not suitable at all with the criteria of measuring the comfort of the flow speed in the passages.
With the passage of air inside the passages, the speed also decreases and reaches about 10 km/h, which is a good amount. The speed felt by the wind in the last row of buildings is much lower (red arrow), and the wind is damped inside the passages.
Temperature Comfort
Step 1: Solar Radiation
The solar radiation is modeled using DO Model and based on geographical coordinates in the middle of February (13 pm).
Figure 7: Solar radiation in the domain
The results show that the taller building has absorbed more radiation and less radiation in the passages between them due to the shadow created by the buildings. The minimum solar incident radiation value is 1560 W/m2 (black arrow), and the maximum is 1700 W/m2 (red arrow).
However, there was no significant difference in people’s thermal sensations between different solar radiation levels in less shaded sites. The hypothesis was that visual comfort brought by shading could affect how people perceive thermal comfort in outdoor environments.
Step 2: Building’s Heat Flux
Most of the Auckland region experiences mean annual temperatures between 14 °C and 16 °C, with eastern areas generally warmer than western areas. They experience lower mean annual temperatures over higher elevations (e.g., Hanau Ranges; 12°C) due to the temperature decrease with altitude.
There is a deal of variability in this figure, with the high ground being relatively colder under windy conditions, while on cold nights’ hill tops may be warmer than the low ground because of cold air drainage. We show the areal variation of annual median average temperature in Figure 6.
Figure 8: Annual median average temperature
To see the temperature changes in the passages and the area, we show the temperature contour at 1.5 meters from the ground. The temperature of the surface of the earth is 286.15 K, and the temperature of the free stream is considered to be 288.15 K based on meteorological data. We use the DO model to apply the effect of solar radiation.
The amount of heat flux that is emitted from buildings, according to comprehensive investigations of building science, for an office building in normal conditions is equal to 0.6 w/m2, which is also applied to the walls of these buildings.
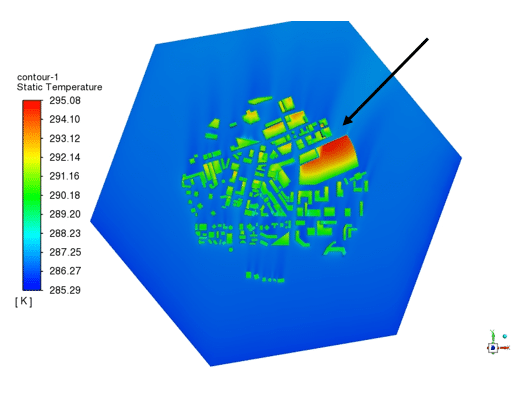
To analyze the temperature results, the temperature contour shows that the buildings heat their surroundings by applying heat flux and form the urban heat island phenomenon, in which in the face of the wind of 288.15 K.
Figure 9: Wind Temperature contour
table 2:
The buildings at the beginning of the route reach a suitable temperature. But the buildings in the back get a little less cold. The meeting hall is a building with a low height but with a larger area (specified with a black arrow).
Compared to other buildings, it cools down later and still experiences higher temperatures in a part of its roof, and the maximum temperature also occurs at this point.
Figure 10: Temperature in the domain. Left up 0.5m. Right up 1m down left 1.5m and downright 2m from the ground surface
table 3:
At a distance of 0.5 meters from the earth’s surface, it is, on average, 287.46 Kelvin. The warm environment between the buildings results from heat rejection from a roofed environment. The highest temperature is 295.77 K.
The average temperature increases slightly at one meter above the ground. It reaches 287.96 K. In this contour, heat transfer from the previous hot platform can be seen. This caused the maximum temperature to reach 292.58 K.
The changes are insignificant at a distance of 1.5 meters from the earth’s surface compared to before. The maximum temperature has not changed.
At a distance of two meters from the ground, as well as at a distance of half a meter, a hot platform can be seen that is transferring heat to the environment and has caused an increase in the temperature in the surrounding environment. The maximum value in this contour has increased and reaches 294.87 Kelvin.
Urban Heat Island Conclusion
In this project, we investigate the urban condition of Auckland from two different aspects. In the first step, related to the wind comfort analysis, the results prove that the wind speed exceeds the standard distance suitable for pedestrian conditions in several areas based on Figures 5 and 6, especially in the suburbs.
Thus, the municipality can consider installing windcatchers or vegetation reproduction in the suburban area to overcome the problem or also make more distance between the close buildings leading to the narrow street canyons.
On the other hand, the thermal comfort investigated in the second step has different conditions. By considering the solar radiation applied to the buildings, there isn’t any specific problem for residents. In the worst-case scenario, considering a heat flux for the buildings, still, the thermal criteria (295K) are satisfied, and there wouldn’t be any hardship for the citizens.


Ms. Elda Waelchi Sr. –
I’m fascinated by how the study incorporates solar radiation in their thermal comfort analysis. Could you provide more detail on the specific method used to measure the impact of solar radiation on UHI effects?
MR CFD Support –
The study utilizes the Discrete Ordinates (DO) radiation model to account for the effect of solar radiation, which is based on geographical coordinates with respect to a specific date and time (in this case, middle of February at 13 pm). This allows for the simulation of solar incidence on vertical and horizontal surfaces, aiding in the assessment of how the built environment shapes the urban heat island effect by altering surface temperatures and shadows caused by structural elements. Solar radiation values are then considered to understand their influence on pedestrian thermal comfort in different parts of the city.
Sydnee Mayer –
The simulation description references three origins for evaluating pedestrian wind comfort. Can you clarify what those three origins are?
MR CFD Support –
The three origins of Historical meteorological data, Local wind conditions, and Specific comfort criteria are used to evaluate pedestrian wind comfort. Historical meteorological data covers past wind speed and pattern observations, local wind conditions assess the current climate with an understanding of geographical and environmental impacts, and specific comfort criteria define the thresholds that wind speed and direction need to meet for pedestrian comfort in urban spaces.
Prof. Daron Conn III –
I found the UHI effect and the impact on wind comfort and temperature very insightful. The data visualization in the graphical images provided clarity on the issues caused by the urban environment in Auckland, giving important cues on potential mitigation strategies like windcatchers. Great analysis!
MR CFD Support –
Thank you for your positive feedback on the Urban Heat Island CFD Simulation study. We’re glad to hear that you found the visualization and analysis insightful and clear in underlining the effects of urban structures on the local climate. The acknowledgment of issues and possible solutions is very valuable to us, and we would like to continue providing high-quality informative simulations. If you need further information or have any specific demands regarding our services, feel free to reach out.
Kayli Jaskolski –
I appreciated the thoroughness in exploring the Urban Heat Island effect and its implications on city planning. The analysis offered helpful insights for both wind and temperature comfort, something which isn’t always considered with such depth in urban studies. Well done on considering diverse factors like solar radiation and heat flux from buildings that are critical for practical urban development proposals. The incorporation of these elements in CFD simulations can significantly help in refining the effectiveness of our urban environments. Keep up the excellent work!
MR CFD Support –
Thank you for your positive review and recognition of the work. It’s gratifying to see that the comprehensive analysis and integration of various factors to study urban heat island effects was helpful to you. Understanding the implications of the UHI on city planning is crucial, and we are pleased that you found the insights beneficial for urban development. We continuously aim to provide valuable research and analysis to aid in the creation of sustainable and livable urban spaces. Your feedback motivates us to keep delivering high-quality simulations and studies. Thanks again for your support!
Nathen Hyatt –
This is an insightful study of UHI effects with a comprehensive approach addressing wind and temperature comfort. Well-explained methodology and thorough analysis!
MR CFD Support –
Thank you for your kind words and recognition of the detailed methodology and analysis in this study of urban heat island effects. We’re glad you found the study insightful and informative.
Dr. Denis Jones –
I was really impressed with the detailed UHI simulation for Auckland’s urban planning. The concerns you’ve addressed will undoubtedly aid urban designers and policy-makers. Great work MR CFD Company!
MR CFD Support –
Thank you for your kind words! We’re glad to hear that you were impressed by our UHI simulation for Auckland. It is our goal to provide detailed and useful analyses to support urban planning and design. Your feedback means a lot to us, and we look forward to offering more valuable insights in our future products.
Henry Ortiz IV –
I’m impressed by the comprehensive analysis of Auckland’s UHI in this simulation. Could you elaborate on the types of vegetation or windcatchers recommended to alleviate the higher wind speeds in certain areas?
MR CFD Support –
Thank you for your positive feedback! In areas experiencing higher wind speeds, strategic planting of trees and shrubs can serve as windbreaks, while vertical gardens on buildings’ sides can help reduce wind velocities. Windcatchers or architectural features like wing walls are also useful for redirecting or slowing down the wind. The specific choice of vegetation or windcatchers would depend on the local climate, urban fabric, and architectural considerations.
Prof. Janessa McClure PhD –
I’m fascinated by the UHI project for Auckland. Could you tell me how you determined the specific numerical values for solar radiation and building heat flux in the simulation?
MR CFD Support –
For the numerical values of solar radiation and building heat flux, very specific conditions of Auckland were analyzed. Solar radiation was modeled using the Discrete Ordinates (DO) model for mid-February around 1 pm, considering the geographical location and time of the year. The values for building’s heat flux were determined based on deep building science investigations for an office setup in average conditions, quantified at 0.6 W/m2. Adequate meteorological data and standard criteria were referenced to ensure realistic and accurate simulation parameters.
Ciara Monahan –
The comprehensive UHI study is fantastic! The detailed analysis provided allows the city planners to effectively address urban climate challenges. Are there any suggested urban design modifications to further alleviate the UHI effects in Auckland, based on your findings?
MR CFD Support –
Thank you for your positive feedback! Based on the findings, we suggest increasing green spaces and implementing reflective building materials to mitigate the Urban Heat Island effect. Strategic placement of trees and vegetation can provide shade and cool the air, while high-albedo surfaces can reflect sunlight to reduce heat absorption.
Viviane Rau –
This comprehensive simulation has given me a richer understanding of Auckland’s urban climate. I’m curious, though, how did the inclusion of complex urban geometry affect the simulation process and results?
MR CFD Support –
Including complex urban geometry in the CFD simulation process is pivotal for accurate representation of the Urban Heat Island (UHI) effect. The geometry impacts the flow patterns and temperature distribution due to varying building heights, which create shadowing effects and alter wind pathways. This complexity necessitates refined meshes around buildings and careful consideration of boundary layer profiles to capture microclimate variations within urban canyons. The sensitivity of the simulation results to urban geometry ensures a realistic portrayal of thermal comfort and pedestrian wind comfort conditions in metropolitan environments like Auckland.
Daisy Buckridge –
Wonderful to see such a comprehensive simulation investigating urban heat island effect – how solar radiation and building heat flux data integrated into this model?
MR CFD Support –
In the UHI simulation, solar radiation is modeled using the DO (Discrete Ordinates) Model by aligning the input with the city’s actual geolocation for precise angling of solar rays. Heat flux data for buildings was included based on studies of building science for office temperatures, ensuring a realistic environmental heat feedback in the model. All factors contribute to an accurate assessment of the thermal comfort and mitigation strategies for UHI.
Dr. Amir Hand MD –
Kudos on the comprehensive analysis on Urban Heat Island effect in Auckland! The detailed breakdown and findings will definitely aid urban developers in making climate-conscious decisions for future infrastructures.
MR CFD Support –
Thank you for the positive feedback on our UHI analysis of Auckland. We’re glad to hear that the information presented is thought to be valuable for urban planning and development strategies aiming for sustainability and climate resiliency. It’s encouraging to see our efforts recognized and set to practical use.
Jude Huels –
Very thorough simulation on Urban Heat Island effect for Auckland! The integration of comprehensive climate data is impressive.
MR CFD Support –
Thank you for your positive feedback! We strive to provide the highest quality in our simulation studies, and your satisfaction is our top priority. If you have more questions or need further details regarding our CFD products, feel free to reach out!
Quinn Altenwerth –
The content on Urban Heat Island simulation for Auckland is fascinating! I appreciated the thorough explanation of flying environment effects on the university campus area. Great work!
MR CFD Support –
Thank you for your kind words! We’re delighted to hear that you found the UHI simulation study fascinating and instructive. If you have any more questions or need further assistance with CFD simulations or analyses, feel free to contact us. Have a great day!
Dustin Abernathy I –
Everything described about the UHI effects and simulation results for Auckland city is insightful. Are there recommended urban design changes to mitigate UHI effects following the study’s conclusions? Additionally, could further measures such as increasing greenery and altering pavement materials enhance the comfort levels even more effectively?
MR CFD Support –
Our simulation analysis indeed provides valuable insights into the UHI effects in Auckland city. Mitigation strategies could include the strategic placement of vegetation, which helps reduce heat build-up by providing shade and promoting evaporative cooling. Redesigning building arrangements to optimize wind flow in urban canyons is also beneficial for dispersing accumulated heat. Advanced planning might incorporate variation in the height of buildings to redirect air currents effectively. Moreover, employing materials with high reflectivity (albedo) for pavements and rooftops can reduce heat absorption. Each measure alone can aid comfort levels, but a combination tailored to the specific urban landscape based on our findings would yield the best results for mitigating heat island effects.
Everette Reinger –
I was impressed by the comprehensive analysis on Wind Comfort and Temperature performed in Auckland. Can you tell me how the solar radiation impacts were ascertained to be insufficient to affect thermal comfort significantly?
MR CFD Support –
The impact of solar radiation on thermal comfort was modeled using the Discrete Ordinates (DO) method and was studied based on the geographical coordinates and the time of the year for Auckland. The simulations showed that while taller buildings absorbed more radiation, the shaded areas between these buildings experienced less solar irradiance. The temperature changes due to radiation are considered alongside meteorological data for the region and the heat flux emitted from the buildings. It seems from the results that visual comfort from shading may overshadow the actual increase in temperature, affecting the perception of thermal comfort more than the slight variations in thermal radiation levels themselves. Hence, no significant discomfort would be experienced by the citizens despite the changes in solar irradiance in less shaded sites.
Shyann Wiegand Jr. –
The use of historical meteorological data in the simulation is very impressive. It seems to add a lot of value to the accuracy of the analysis. Can you elaborate on how this historical data is integrated and if there’s any room for error when using it?
MR CFD Support –
Historical meteorological data is an essential input in our Urban Heat Island (UHI) CFD Simulation process. We integrate this information into the simulation by inputting past wind speed and direction data, average temperature, and other relevant climate information for Auckland. The software then uses this historical data to simulate and predict wind comfort and temperature comfort areas. While historical data increases the accuracy of the simulation, there is always some room for error due to unpredictable variables such as sudden climate changes or new constructions that alter wind patterns. However, efforts are made to minimize this through careful data analysis and consistent updates to the simulation model as new data becomes available.
Miss Leanne Satterfield –
I’m delighted with how comprehensive the ‘Urban Heat Island’ simulation analysis is! The depth of insight into both wind and temperature comfort areas provides a robust understanding of Auckland’s urban climatology. The combination of meteorological data, physical modeling, and CFD simulation seems incredibly effective in helping urban planners and architects account for environmental factors. The detailed approach to both airflow dynamics and heat flux considerations is impressive. Great job MR CFD Company—this will surely aid in developing strategies for more sustainable urban living.
MR CFD Support –
Thank you for your kind words! We’re thrilled to hear that our ‘Urban Heat Island’ simulation was able to provide you with a thorough understanding and valuable insights. Our goal at MR CFD Company is to empower professionals with detailed analysis and accurate modeling to make better-informed decisions for sustainable development. Your feedback is greatly appreciated, and we hope our products will continue to be an asset to your planning efforts.