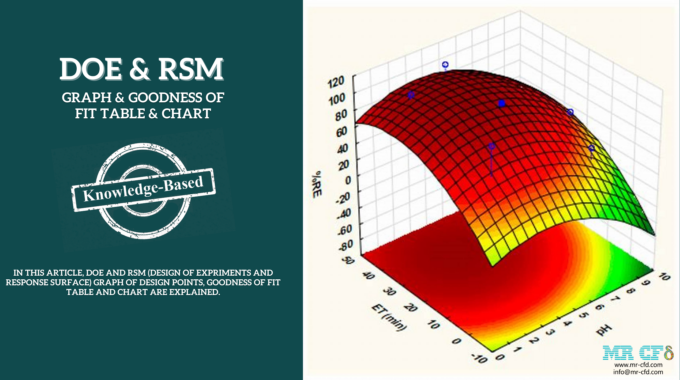
DOE and RSM: Graph & Goodness of Fit Table & Chart
DOE and RSM Graphs
This article aims to talk about DOE and RSM graphs and charts including:
- graph display of design points,
- the goodness of fit table
- chart
Graph Display of Design Points
These DOE graphs (a graph of design points) represent the representation form of the values defined for each input parameter, including the parallel representation of parameters (parameters parallel) and the display of design points with each parameter (design points vs. parameter ).
Figure 1 shows an example of a graph of design points vs. parameters for each input parameter (design points vs. parameters). As input parameters, the right and left y-axes represent the range of radius and length changes, respectively, and the lower horizontal axis (x-axis) represents the number. Production design points in the design method are optional.

Figure 1. Graph of Design Points Based on Each Input Parameter
Figure 2 shows an example of a graph showing the composition of the design points of each of the input parameters (parameters parallel). The horizontal axis (x-axis) consists of three defined input parameters. The vertical axis (y-axis) represents the range of changes related to each of the three input parameters, including each parameter’s minimum to a maximum value.

Figure 2. Graph of Parallel Design Points
DOE and RSM: Introducing Goodness of Fit Table and Chart
At the end of the response level creation process, a table is activated by ANSYS Workbench software. This provides the quality criteria for the response levels. These criteria examine the quality of the response levels generated by solving the design sample points. Types of the goodness of fit criteria are:
- Coefficient of determination or the same as square size R (coefficient of determination or R2 measure)
- Maximum relative residual
- Root mean square error
- The Relative root mean square error
- Relative maximum absolute error
- Relative average absolute error
Each criterion for measuring the goodness of fit of the response levels has a value as its best value. Suppose each of the measurement criteria obtained for each parameter or numerical output variable was equal to the value of the best state of that measurement criterion. In that case, the response levels are estimated to be the best and have the least error.
When the best response level state for a given output parameter is reached according to a specific measurement criterion, a three-star gold symbol is displayed for that output parameter. Now, the farther the number obtained from each measurement criterion is from the best state number, the fewer the number of golden stars. Suppose the number obtained from each of the measurement criteria for a given output parameter is too far from the best state value of that criterion. In that case, the response levels are estimated to be very poor, resulting in a red cross for that parameter. Is displayed.
The table below shows the best value for each of the quality metrics:

Definition of Coefficient of Determination, Maximum Relative Residual, and Root Means Square Error
Definition of Coefficient of Determination
It measures how much the quality of the resulting response indicates the quality of variability. The closer the size of this criterion is to number one, the better the response level. The formula for this criterion is as follows:

Definition of Maximum Relative Residual
A similar measure of the response level using intermittent mathematical expression. The closer the magnitude of this criterion is to zero, the better the response level. The formula for this criterion is as follows:

Definition of Root Means Square Error
A measure is equivalent to the square root of the mean square residuals at the design points in the test environment for regression methods. The closer the magnitude of this criterion is to zero, the better the response level. The formula for this criterion is as follows:

Definition of Relative Maximum Absolute Error
A measure equal to the residual value of the absolute maximum relative to the standard deviation from the actual output data. The closer the magnitude of this criterion is to zero, the better the response level.

Definition of relative average absolute error. A measure equal to the average error relative to the standard deviation from the actual output data. This error measure applies when the number of sample design points is less than 30. The closer the magnitude of this criterion is to zero, the better the response level.

An Example for Better Understanding
For example, suppose there are two output parameters or variables, including the outlet temperature and the pressure drop, on which the effects of changes in the input parameters lead to a response level. This example uses the kriging method to generate the response level. Figure 3 shows a table of quality criteria for each output parameter.

Figure 3. Quality Criteria in an Example with Two Output Parameters.
ANSYS Workbench evaluates the goodness of fit from response levels (RSM) according to the unique goodness of fit diagram. This criterion indicates the degree of proportionality or similarity between the values obtained from the solution process at the design point in the test environment (DOE) with the points on the response surface estimated by creating response surfaces (RSM). In the diagram related to this criterion, the horizontal axis represents the observed points from design points (observed from design points). The vertical axis represents the estimated points from the response surface (predicted from the response surface). If we use a 45-degree line as the boundary for comparing the values of these two axes, the higher the density of points related to the results of the output parameters on and around this boundary, and the less scatter, the higher the quality of the response levels.
We have investigated the changes in output temperature and mass flow output. We have done this investigation in terms of changes in three input parameters using the response surface method (RSM). Figure 4 shows the quality diagram of the fit between the values of the output temperature and the output flow rate in the test medium and the values obtained from the production of the response surface. As a result, the quality of the production response level is high.

Figure 4. Fit Quality Diagram for Two Output Parameters
Related Posts

CFD Project Outsourcing: What Files, Reports, and Results Should You Expect?
When engineering teams decide to outsource CFD simulation, the conversation almost always starts with capability and…
ANSYS Fluent Consulting: Get Defensible, Audit-Ready Simulation Results
You need ANSYS Fluent results that can survive scrutiny — a design review, a client…

CFD Simulation Services for Product Design: Reduce Prototyping Cost Before Manufacturing
In modern product development, the most expensive mistakes are often discovered after money has already…
Comments (0)