Drone CFD Analysis in Low and High Altitudes, ANSYS Fluent Simulation Training
$180.00 Student Discount
In this study, the effect of different altitudes of a high-speed drone has been studied using ANSYS Fluent software.
Click on Add To Cart and obtain the Geometry file, Mesh file, and a Comprehensive ANSYS Fluent Training Video.To Order Your Project or benefit from a CFD consultation, contact our experts via email ([email protected]), online support tab, or WhatsApp at +44 7443 197273.
There are some Free Products to check our service quality.
If you want the training video in another language instead of English, ask it via [email protected] after you buy the product.
Description
Project Description
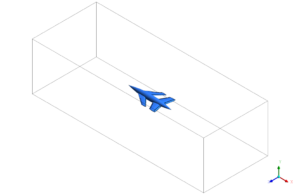
In this study, the effect of different altitudes of a high-speed drone has been studied using ANSYS Fluent software. The fluid is air, and we considered it as a compressible ideal gas. The maximum speed of the drone is 30 m/s, and the investigated altitudes are 20m and 2000m as low and high altitudes, respectively.
Assumption:
The assumptions that we used in this study are listed below:
- Steady-state
- The flow is turbulence
- Compressible ideal gas
- All zones around the drone are symmetry
- Density-Based solver
Drone Geometry & Mesh
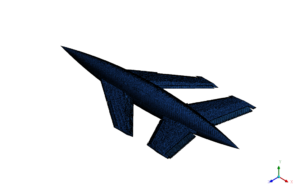
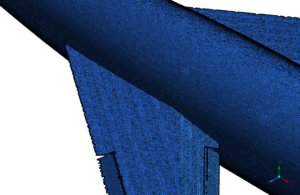
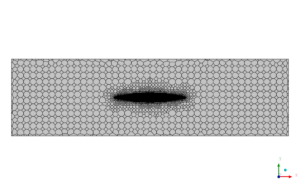
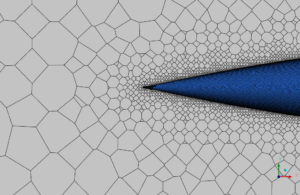
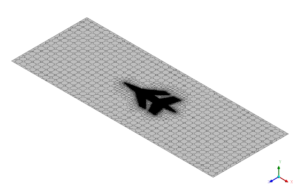
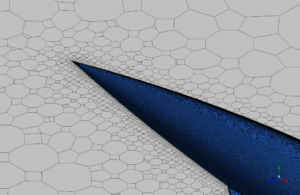
The Spaceclaim software fixed the geometry. The mesh was generated using the octree method by ANSYS Meshing software, and the Delaunay method has been used to improve the quality of the existing mesh. Finally, to prevent a high aspect ratio and low skewness, the mesh was converted from tetrahedron to polyhedral, decreasing the number of elements. The final number of mesh is about 12000000 cells.
Drone Model Setup
Table 1 shows all the settings which is used in this study.
Table 1. Model setup and boundary conditions
| General Settings | |
| Gravity | |
| Solver type | Density Based |
| Time | Steady |
| Models | |
| Viscous | Inviscid |
| Viscosity | Constant (Air) |
| Density | Ideal gas |
| Boundary Conditions | |
| Inlet | 30 m/s |
| Outlet | Pressure Outlet |
| Wall | Symmetry BC |
| Solution Methods | |
| Coupling of Pressure-Velocity | SIMPLE |
| Spatial Discretization | 2nd order for Pressure and Momentum |
Results
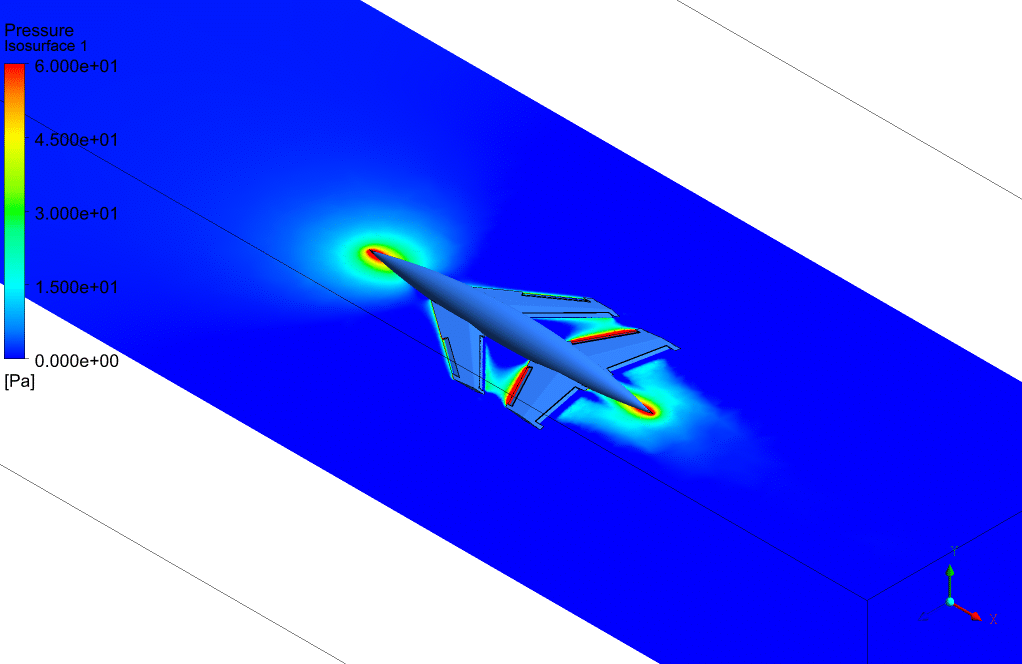
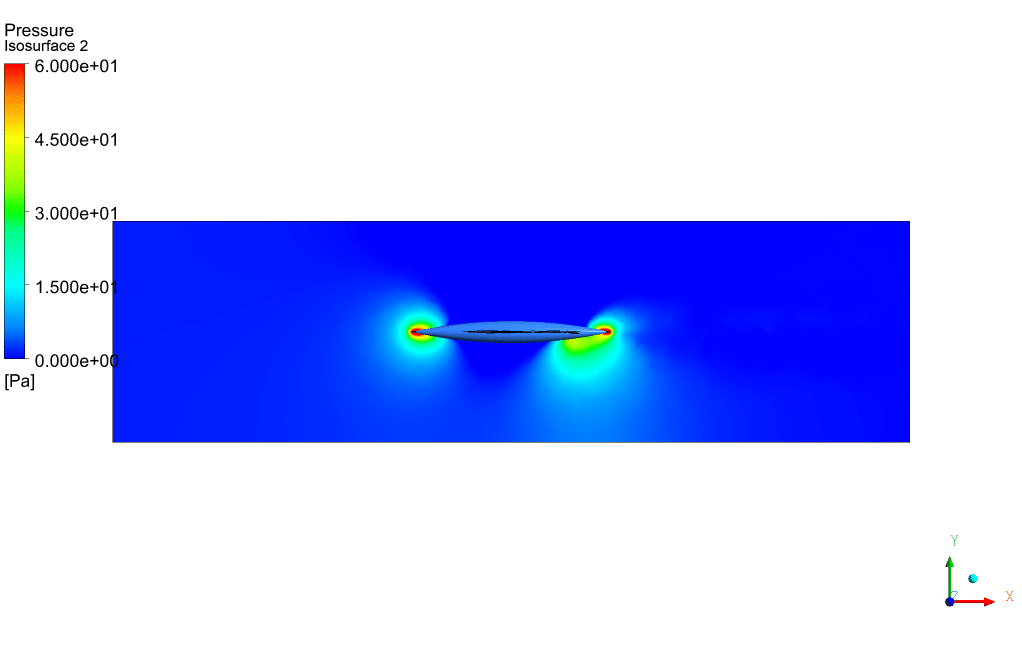
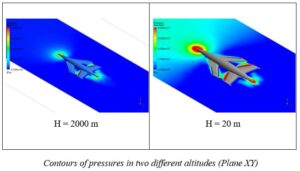
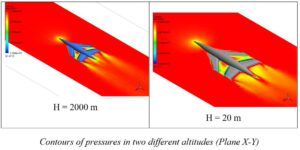
The following figures illustrate pressure distribution around the drone in two different altitudes. According to the contours, pressure in 2000 m is lower than 20 m. This is because at the altitude of 2000 m, the temperature is around 3℃, and the pressure is around 70,000 Pa less than the atmospheric pressure at 20m height. Therefore, the pressure will have a more impact on the drone at the lower altitude.
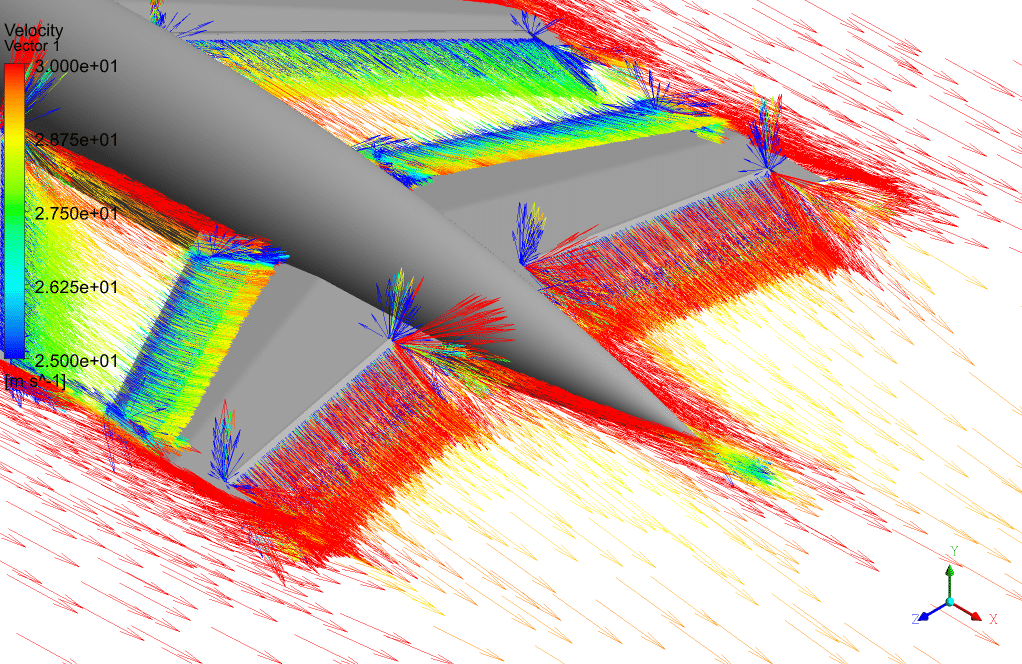
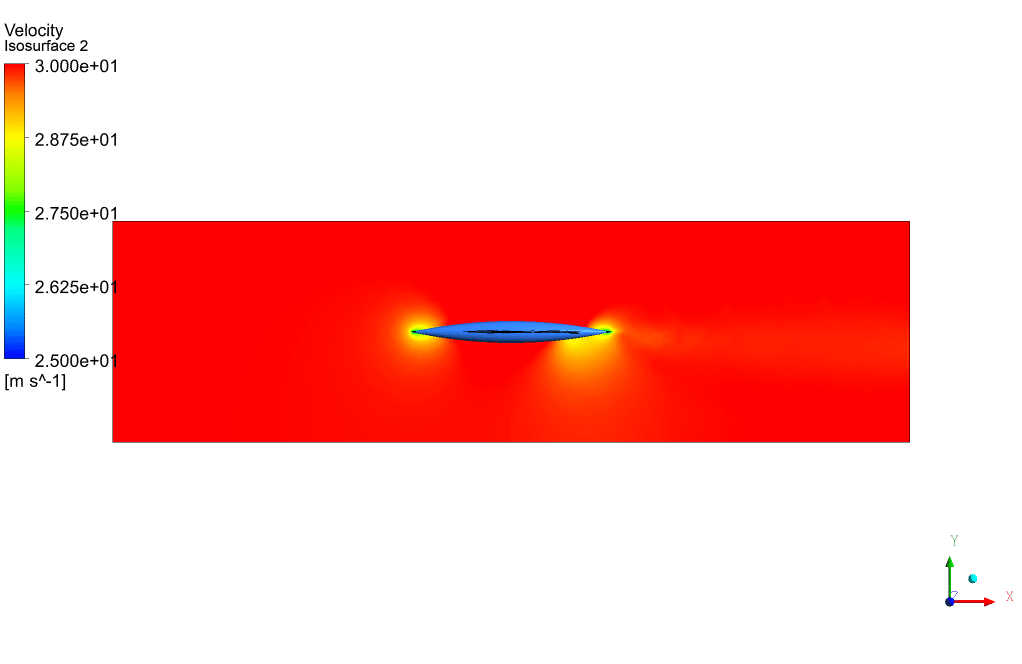
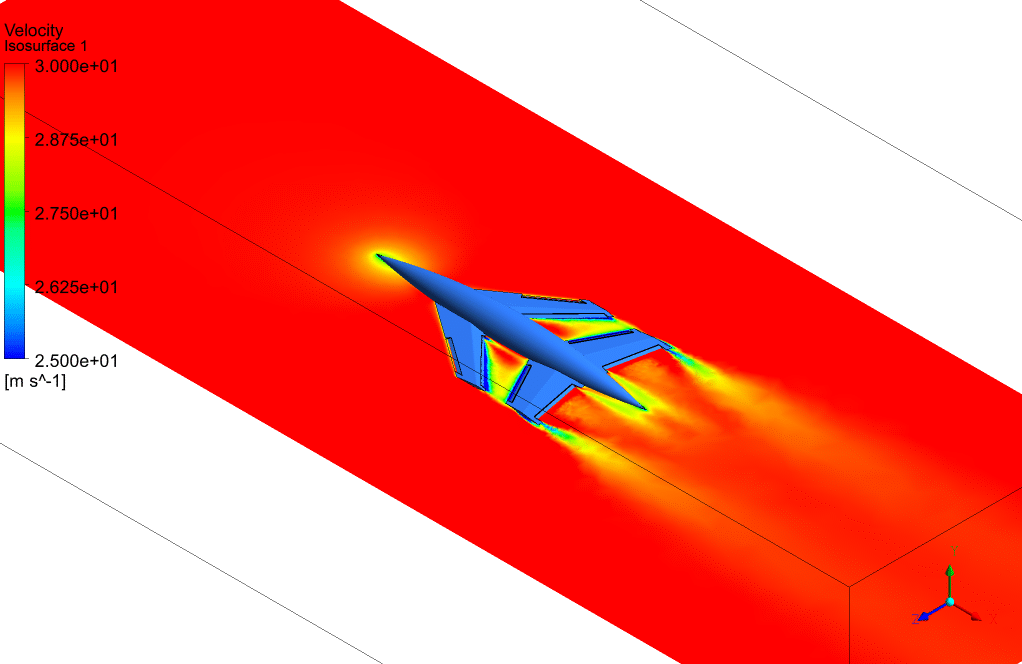
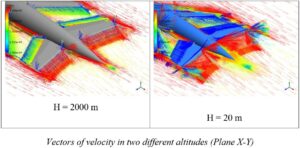
According to the velocity contours, the velocity is lower at the drone’s back at the altitude of 20 m than the altitude of 2000 m.
To see what is going on there, the following shows some vortex there, that can have some negative impact on the movement of the drone.
The drag coefficient at the altitude of 20 m and 2000 m are about 0.011868 and 0.00756, respectively. It means, at the low attitudes drag force is more than the higher altitudes.

Dr. Arturo Kerluke –
After reviewing the project description, I must say I’m genuinely impressed with the comprehensive nature of the drone CFD analysis at low and high altitudes using ANSYS Fluent. The methodology provided detailed insight into the effects of pressure and air density on the drone’s performance, which are critical factors to consider for its operation in different atmospheric conditions. I appreciated the utilization of the density-based solver for the compressible airflow, a realistic choice for drone aerodynamics given the variations in air pressure at different altitudes. The transition from a tetrahedral to a polyhedral mesh was also a smart choice and showcases a nuanced approach to improve computational efficiency without compromising accuracy. The clarity in reporting the findings, especially the impact of the different altitudes on the pressure distribution and drag coefficient, was very helpful. This training module has deepened my understanding of the fluid dynamics involved in unmanned aerial vehicle operations and emphasizes the versatility of ANSYS Fluent in tackling such complex simulations.
MR CFD Support –
Thank you for your thoughtful review of the ‘Drone CFD Analysis in Low and High Altitudes, ANSYS Fluent Simulation Training’. We are pleased to hear that the training module will inform your understanding of drone aerodynamics and that you found the mesh optimization strategies particularly insightful. We continually strive to offer detailed and practical educational material, and it’s great to see the positive impact it has had on your learning experience. Your recognition of the effort invested in delivering concise and significant analysis emphasizes the quality we aim for in our simulations. Thank you once again for your positive feedback, and we look forward to providing more quality educational experiences in the future.
Leonel Nikolaus Jr. –
I was fascinated by the change in drag coefficient between different altitudes. Could you explore why there’s a greater drag at lower altitudes?
MR CFD Support –
The greater drag at lower altitudes is mainly due to the higher air density and pressure at these lower altitudes. At 20m, the atmospheric pressure is greater, and with higher density, the molecules are packed more tightly together, causing more resistance against the moving drone. This increased resistance translates to a higher drag force combating the drone’s motion. The temperature also plays a role; lower temperatures cause the air to be denser as well. The combined effect results in higher drag at the lower altitude of 20m compared to 2000m, where the air is less dense.
Katlyn Hayes –
I recently completed the ‘Drone CFD Analysis in Low and High Altitudes, ANSYS Fluent Simulation Training’, and it was excellent! The step-by-step guide was very insightful and gave me a clear understanding of how altitude affects the aerodynamics of a drone. The visuals and results were detailed and easy to follow, an impressive training material indeed.
MR CFD Support –
Thank you for your positive feedback! We are delighted to hear that you found the training material clear and insightful. It’s great to know that the step-by-step guide helped in understanding the complex aerodynamics at different altitudes. We appreciate your review and look forward to providing you with more quality learning products in the future.
Ali Moen –
I’m thrilled with how detailed the drone’s altitude effect on aerodynamics is presented. The analysis really shows how altitude changes impact performance!
MR CFD Support –
Thank you for your kind words! We’re glad to hear that you found the analysis detailed and informative. It’s wonderful to learn that our drone CFD analysis has provided you with clear insights into how different altitudes affect aerodynamic performance. If there’s more you’d like to explore or learn about, we’re always here to assist!
Mr. Sherwood McLaughlin PhD –
The explanations of the simulation are clear. I particularly appreciate the discussion on the impact of pressure variation with altitude and how it influences drone aerodynamics. Keep up the good work!
MR CFD Support –
Thank you for your kind review. We’re glad to hear the project’s details were informative and helpful for understanding the complexity of drone aerodynamics in varying altitudes. Your feedback is much appreciated, and if you have any further questions or curiosities, don’t hesitate to ask.
Keegan Donnelly V –
I’m really impressed with the comprehensive analysis for the high-speed drone at different altitudes using CFD. The attention to detail considering compressibility and the solver adjustments is commendable. The study’s demonstration on how altitude affects pressure and drag on the drone provides critical insights, especially for drone designers and aerodynamics engineers. It’s definitely a valuable approach to anticipate and refine drone performance under varying atmospheric conditions.
MR CFD Support –
Thank you for your positive feedback! We’re glad that you found the drone CFD analysis valuable and our attention to detail to your satisfaction. Insights like these are exactly what we aim to provide to enhance product design and performance. Your comments are greatly appreciated, and we look forward to providing you with more quality analysis and training materials in the future.
Miss Nicole Dooley DVM –
What impacts does altitude have on the drag coefficient of the drone, and how is this simulated in ANSYS Fluent?
MR CFD Support –
The impact of altitude on the drag coefficient of the drone is significant. At higher altitudes, the air density is lower, which results in reduced aerodynamic forces acting on the drone, including drag. This reduction in drag at higher altitudes is simulated in ANSYS Fluent by adjusting the air properties like density and viscosity to reflect the conditions at different altitudes. The solver uses these properties along with the drone’s geometry and the specified flow conditions to calculate the aerodynamic forces, including the drag coefficient.
Miss Onie Goldner –
Fantastic course content! Learning CFD analysis for drone performance at varying altitudes has greatly enriched my understanding of aerodynamics in different atmospheric conditions. The transitions from low to high altitude in simulations really demonstrated practical changes in environmental effects on drone flight. A gem for any aerospace enthusiast or professional!
MR CFD Support –
Thank you for your kind words! We’re thrilled to hear our training on CFD analysis for drones at various altitudes has provided valuable insights into aerodynamic performance. Your enthusiasm for the subject really shines through in your review, and we appreciate the time you took to share your positive experience. Keep soaring high in your aerospace endeavors!
Buddy Abernathy –
The training was impressive! The detailed results really helped me understand how drone performance is affected by altitude changes. Very informative!
MR CFD Support –
Thank you for your positive feedback! We’re thrilled to hear that our simulation training on the effects of altitude on drone performance was informative and helpful for you. If you have any more questions or need further clarification on any topics, feel free to reach out. We’re always here to help enhance your learning experience.
Dr. Olen Hodkiewicz –
I’m pleased to see that the CFD analysis has considered two distinct altitudes. The detail about the compressible nature of air and the attention given to ensure quality meshing by converting to polyhedral suggests a precise and careful approach to the study. It’s impressive how the simulation captures the variations in pressure distributions at different altitudes and their effects on the drone performance. The lower drag coefficient at high altitudes illustrated in the results indicates a potential performance increase which is very informative for drones designed for varied functional altitudes.
MR CFD Support –
Thank you for your insightful observation and for acknowledging the thoroughness of our CFD analysis! We’re glad that you appreciated the care we took in simulating the drone’s performance under different atmospheric conditions. Understanding how these factors impact the functionality of drones at various altitudes is critical for their design and operation, and we are pleased to contribute valuable insights in this field. We’re delighted that our product met your expectations and provided you with useful information!
Prof. Earnestine Moore –
I’m quite impressed with the CFD analysis of the high-speed drone at different altitudes! In the simulation, you’ve modeled the pressure differences very well. At high altitudes, thinner air makes for less drag – smart consideration for drone design and efficiency. At the same time, any findings on how the reduced pressure affects battery life or propeller efficiency? It can influence flight time significantly.
MR CFD Support –
Thank you for your positive feedback! We’re glad you found the CFD analysis insightful. Regarding your question, this study primarily focused on aerodynamic properties like drag coefficients in different altitude situations. Factors such as battery life and propeller efficiency warrant a separate analysis. They involve thermal and mechanical aspects outside the scope of this study. However, you’ve brought up important points that engineers must consider when designing drones for varying altitudes. We’ll keep these factors in mind for future research and provide even more comprehensive insights.
Adell Padberg –
The color grading of the pressure distribution in the study’s illustrations—does it reflect different intensities in a linear fashion or are they normalized based on the altitude-specific conditions?
MR CFD Support –
In the provided illustrations, the pressure distribution colors are typically graded to reflect differences in intensity. Typically, this kind of grading is linear, allowing for a more intuitive understanding of pressure variation across the drone’s surface. If the altitudes have significantly different atmospheric pressures, it may be that the grading is adjusted or normalized to account for these differences, enabling more direct visual comparison.
Prof. Lexi Okuneva MD –
Are the effects of the drone’s propellers on the fluid dynamics included in the study, or is it an assumption that they are operating consistently across all simulated conditions?
MR CFD Support –
In this study, the effects of the drone’s propellers on the fluid dynamics are not directly included. The simulation focuses on the behavior of the surrounding air at different altitudes and assumes a steady-state flow with a drone velocity of 30 m/s, abstracting the propellers’ contributions to a simplification of the drone’s movement through the atmosphere.
Sigrid Koepp –
This training pack’s content helped me a lot in understanding the impact of altitude on drone performance. The way the results for different altitudes were depicted in figures made it easier to grasp the concept. Really insightful work!
MR CFD Support –
Thank you so much for your kind words! We’re thrilled to hear that our training product was able to provide you with a clear understanding of how altitude affects drone dynamics. We pride ourselves on creating educational content that not only informs but is also visually intuitive. If there’s anything else you’re curious about or any other way we can assist, please let us know!
Sonia Robel V –
The simulation overview was clear, but could you share why polyhedral meshing was preferred over other types?
MR CFD Support –
Polyhedral mesh was chosen because it provides a better quality of mesh with lower skewness and a higher aspect ratio, which contributes to more accurate numerical solutions and stability in simulations. Additionally, polyhedral meshes can help reduce the computational costs as they tend to require fewer cells to accurately represent the geometry compared to tetrahedral meshes.