Practical Exercise Applying DOE & RSM for an Optimization
Optimization process(DOE & RSM) in ANSYS- in Simple Words
This article will discuss the optimization process and explain the related terminologies such as DOE & RSM, CCD, etc. Using an example, we will further introduce the mentioned methods and options.
The first step in analyzing the behavior of any system is to identify the affecting parameters; next, the identified parameters should be varied to study how they can change the whole system. Different parameter study methods can be conducted to investigate the system behavior when the related parameters are varied. The simplest way is to change each parameter one at a time and observe the changes. Nevertheless, this method requires numerous experiments and is very time-consuming; besides, it is impossible to observe the interaction of different parameters and their combined effect on the outcome. To solve this problem Design of Experiment (DOE) method can help. Using this method, a researcher can account for all the possible combinations of affecting factors together and be confident regarding the coverage of all plausible cases.
Using the DOE method, not only can users come up with a table of experiments in which it include all the needed input parameters and their combination, but also the users can define the range of changes for each parameter, culminating in a table which its headers are the input parameters and each row of that table denotes to one solution process or design point. For example, the MR-CFD team created the DOE table needed for the optimization process of a combustion chamber (Fig. 1), considering eight different input parameters, including Air inlet diameter, Fuel inlet diameter, Outer diameter the combustion chamber, etc. (Fig. 2). Using the table generated by ANSYS, we conducted 81 studies to assess the combined effect of the input parameters on the outputs (including Outlet temperature, Chamber heat flux, etc.) (Tab. 1).

Figure 1. Geometry of the Combustion Chamber and the Input Parameters

Figure 2. DOE table generated for optimization of a combustion chamber
Table 1. list of input parameters along with their respective range and the defined output parameters(targets)

It should be pointed out that the number of design points (in this example, 81) is highly dependent on the selected DOE type. Users can select among multiple options, including Central Composite Design (CCD), Box-Behnken Design (BBD), optimal space-filling design, etc., in ANSYS (Fig. 3). The two commonly used methods to generate DOE tables are CCD and BBD.
Essentially, the difference between the mentioned methods is how they divide the input factor’s range of changes, which significantly impacts the number of design points and accuracy of the study. For instance, using the BBD method, the defined range for each input parameter is divided into three different levels, including -1, 0, and +1. +1 and –1 denote the maximum and minimum value for each parameter, respectively, and 0 indicates the value in the middle of the defined range.
While in the CCD method, the division level increases to 5 different levels, including –𝛂, -1, 0, +1, +𝛂, in which the +𝛂 and –𝛂 are the maximum and minimum of the defined range for each input parameter.
As you can see, the CCD method divides the range for each parameter into five levels and generates more design points compared to the BBD method. However, the higher the number of design points, the longer the solution process and the higher the computational cost; on the other hand, increasing the number of design points can increase the accuracy of the optimization process.

Figure 3.Design of experiment subtypes
To optimize the design of a system, we can choose between direct or indirect optimization methods. you can generate using the direct method, a design of an experiment table containing random samples taken from the parameters’ defined range. In this example, the user has to define the needed targets (such as maximizing the generated heat, minimizing the formed pollution, etc., in this example). Then the software will start the optimization process and finally introduces the three best candidate points based on the user’s objectives. This method can be used to obtain the optimized solution quickly; however, no explicit intermediary or graphical data can be extracted for the effect of single or multiple parameters on the defined targets.
In this case, the indirect optimization method can be helpful. In our example of optimizing the combustion chamber, we first used the Central Composite Design (CCD) method to generate the DOE table, which has fewer experiments than the direct method’s DOE table. We then used the Response of Surface (RSM) method to perform the optimization process.
The RSM method uses machine learning algorithms such as genetic aggregation, kriging, neural network, etc., to obtain a mathematical function that defines the target(s) based on the input parameters and shows this function through a surface (Fig. 4). In simple terms, we first consider multiple affecting input parameters for a system, then using the CCD or BBD methods, we turn the defined range for each input parameter into separate points and combine the separated points of each parameter to obtain a design point.
Hence, the generated design points will form the DOE table. Subsequently, experiments (or, in our case, simulations) are conducted to obtain answers for the defined target(s). Finally, the RSM method uses Machine Learning algorithms to get a mathematical function that predicts the system’s response due to changes in input parameters for cases that have not been investigated.

Figure 4. Design of experiment subtypes
As soon as you obtain an approximate function or model, you can test by the good-fit method to see if the answer is satisfactory. If your answer not confirm, then the estimation process starts again, and more experiments perform (Fig. 5). Finally, when you obtain the appropriate function, also you can extract different types of graphical data, including surfaces that show the functionality of the target(s) based on input parameters. As can be seen in the goodness of fit graph, there is a good agreement between the predicted values (predicted function) and the points which have been simulated.
Therefore, you can trust the obtained data to give you the optimal values for each outlet parameter based on the inputs. You can extract many different 3D surfaces to better view the results and understand the mutual effects of each input parameter over the output. For instance, in Fig. 6 to 9, you can see the relation between targets and input parameters for the combustion chamber optimization study.

Figure 5.The good-fit method used to observe the accuracy of the obtained model for combustion chamber optimization process
Again, as shown in Fig. 5, almost all of the investigated cases have accumulated near the predicted model, indicating a good agreement between the simulated cases and the cases that the obtained model predicts.

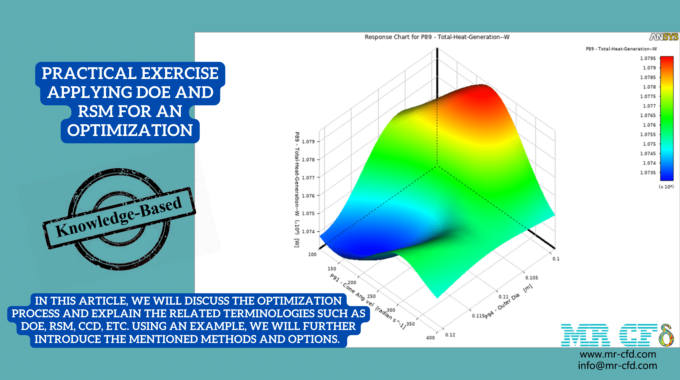
Figure 6. Total heat generation output, based on offset in air and offset in fuel inlet

Figure 7. outlet temperature outlet, based on offset in air inlets and vertical cone length

Figure 8. outlet CO mass friction outlet, based on the cone angular velocity and offset in the air inlet
By viewing the local sensitivity chart, you can understand which input parameter affects outputs the most. The effect of each parameter on the output explaines through assigning a value between -100 to +100. The value of -100 indicates the most negative effect while the value of 100 shows the most positive, and of course, the value of 0 indicates no effect. For instance, in this project, you can easily say that the combustion chamber’s cone angular velocity (red color) and outer diameter (orange color) play a distinct role almost over all the output parameters.

Figure 9. local sensitivity chart for the optimization of the combustion chamber
Finally, in the spider chart, you can observe the responses for each parameter. (i.e., when we have the highest value for parameters 1 (outlet temperature), 2 (outlet CO2 mass fraction), 4 (average temperature), 5 (total heat generation), and 6 (chamber heat flux), parameter 3 (outlet CO mass fraction) will have its least value which is entirely logical since when we have a complete stoichiometric reaction, the generated heat will reach its highest value while the mass fraction of CO will reach zero.)

Figure 10. Spider chart indicating the relation between the output targets and input parameters
We have discussed the optimization process in ANSYS in basic terms and in a practical manner in this post. We learned about direct and indirect optimization strategies, as well as how to retrieve the software’s output. Select this product from the Training Shop to gain access to a product or a practical demonstration.
in this product, a combustion chamber performance is optimized using DOE and RSM.
Related Posts

CFD Project Outsourcing: What Files, Reports, and Results Should You Expect?
When engineering teams decide to outsource CFD simulation, the conversation almost always starts with capability and…

ANSYS Fluent Consulting: Get Defensible, Audit-Ready Simulation Results
You need ANSYS Fluent results that can survive scrutiny — a design review, a client…

CFD Simulation Services for Product Design: Reduce Prototyping Cost Before Manufacturing
In modern product development, the most expensive mistakes are often discovered after money has already…
Comments (0)